Before I get into this blog post I’d like to ask you to head over to The Wisconsin Alliance for Civic Trust, read up a little bit on what they are all about, their very intentional cross-partisan cooperation, and then do your part and stand up for the principles they talk about and join.
I’ve written multiple times about this organization, here are a couple of links;
“The Wisconsin Alliance for Civic Trust” Is One Helpful Solution For A Better Tomorrow!
WisACT can change our vitriolic politics for good. Letter to the Editor, Wisconsin State Journal. Sorry there is a paywall and I have no idea how to get around it. Here is an excerpt…
“At this point in time, WisACT might be a pebble in a torrent of seemingly uncontrollable vitriolic political rhetoric, but thanks to leaders like those who are building WisACT, that pebble could be turned into a boulder with massive waves pushing the winds of change. Leaders know how to multiply their energy, creativity, intelligence, information base and experience. Be the leader who helps multiply this seemingly insignificant pebble into a boulder.”
The more people we have in this Wisconsin organization the more clout we have. Please add your name to the list of people that stand up for these principles.
Now we return you to the core of this blog post.
Since our votes have a tendency to reflect our views on what’s happening in our society and whether voters think we’re on the right path, the following is looking back 40+ years at voter trends.
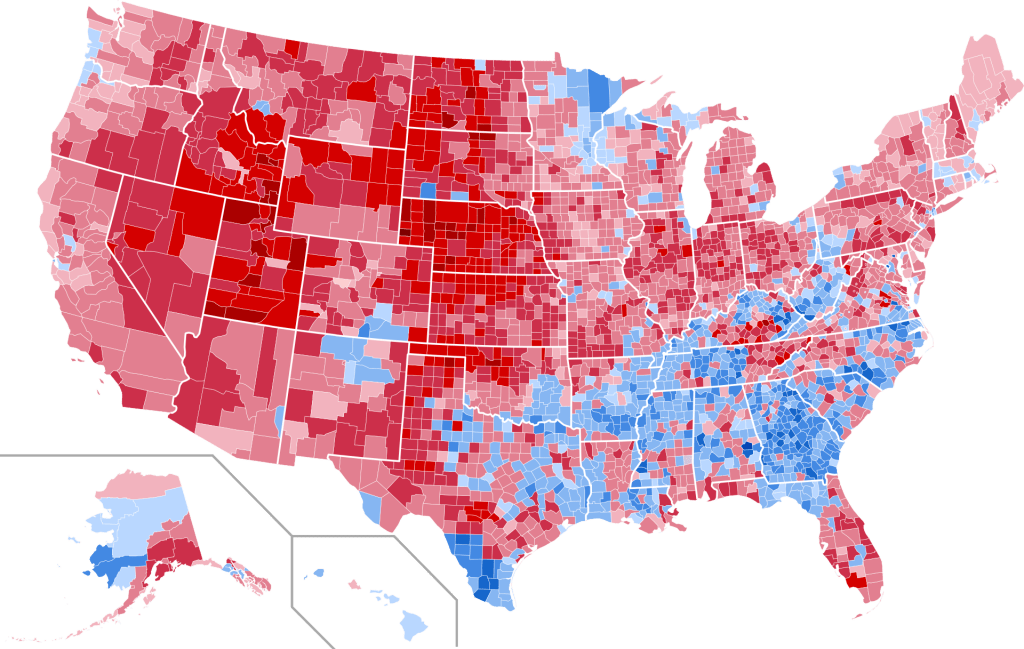
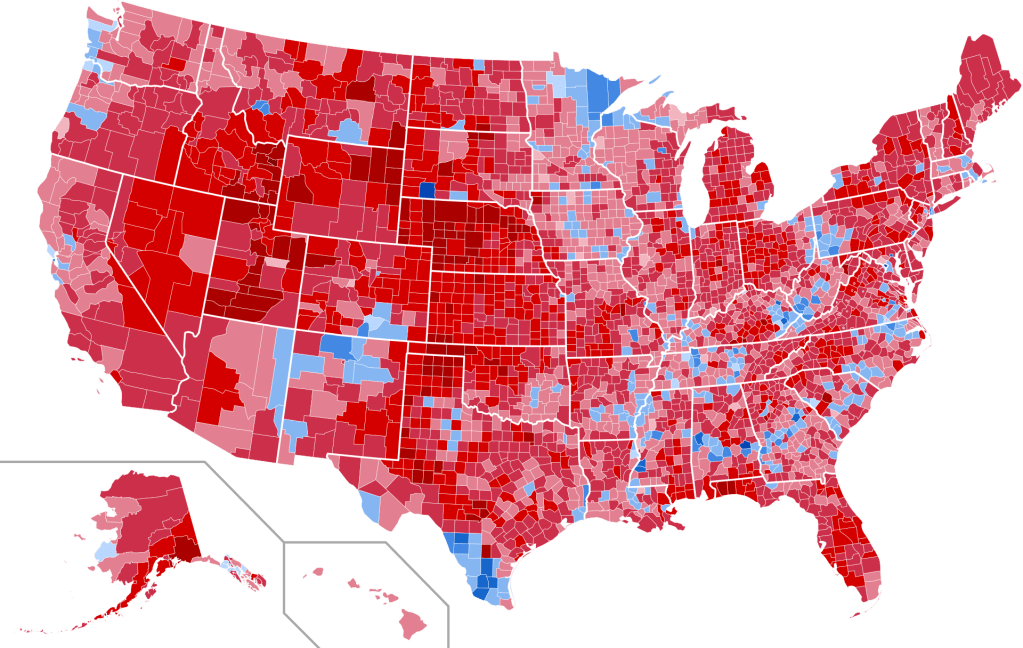
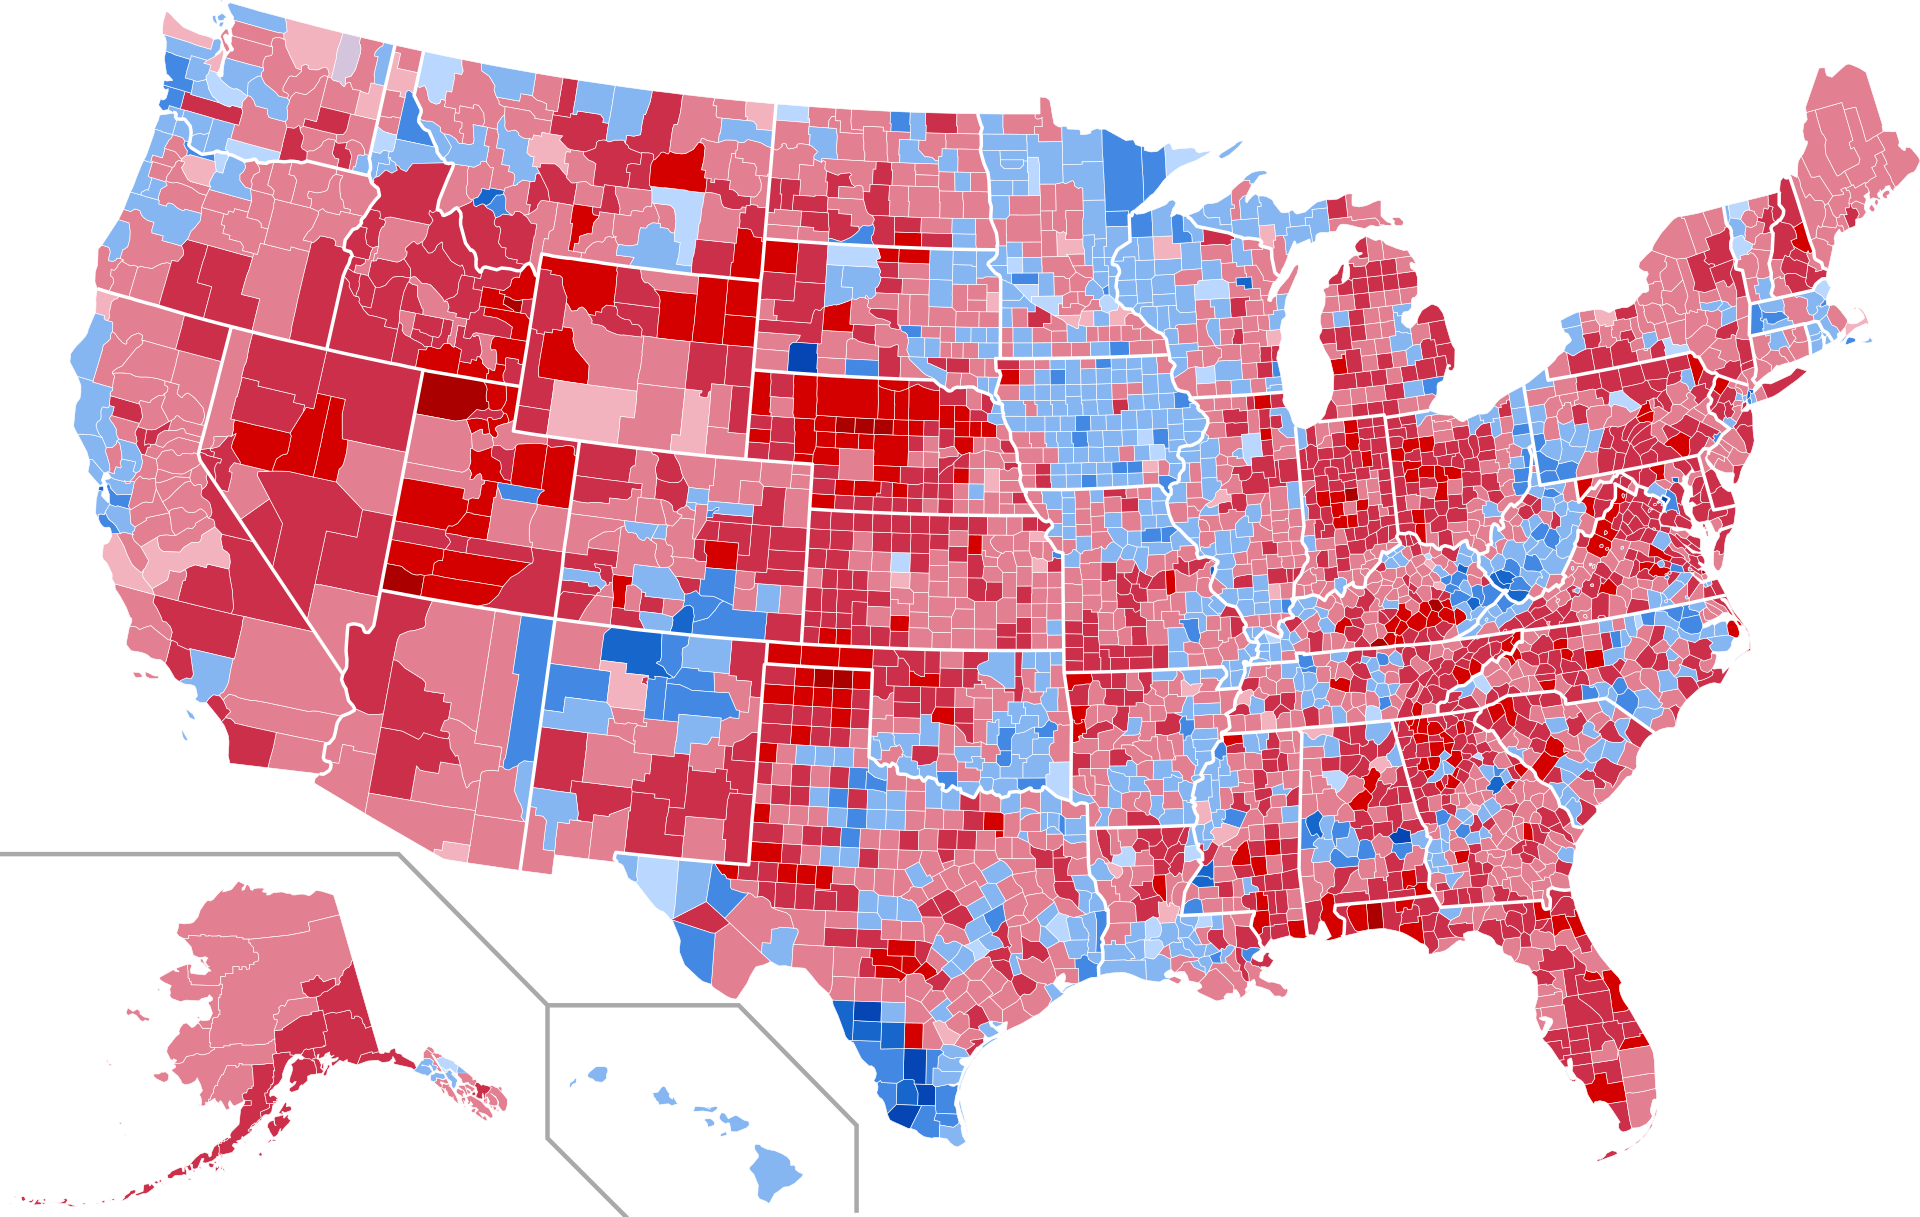
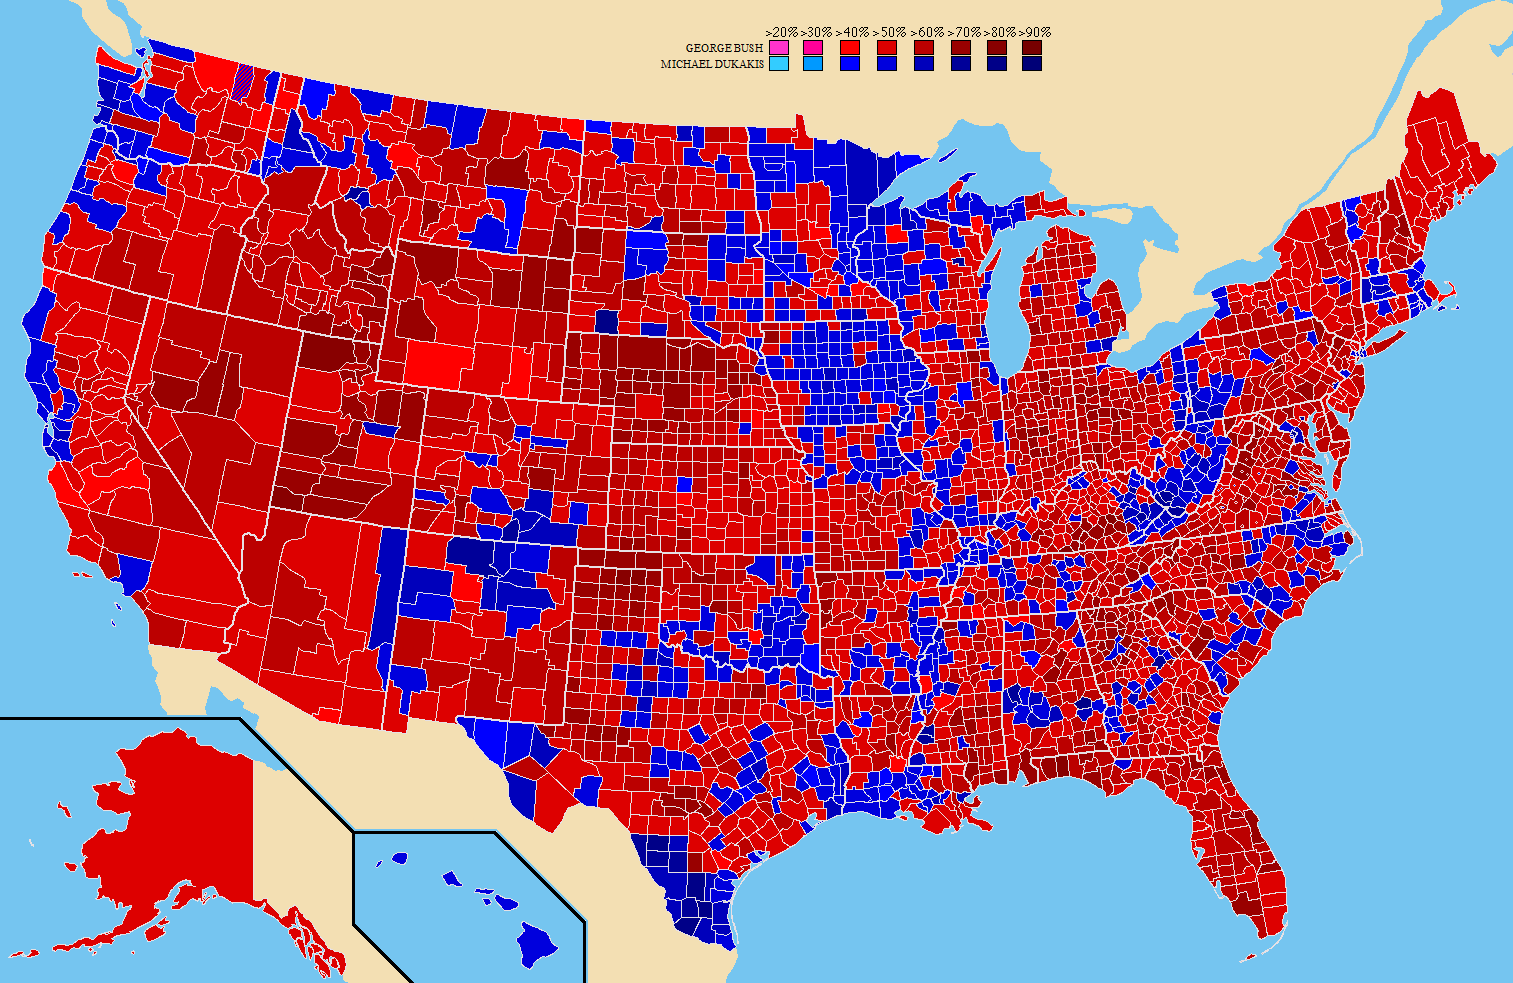
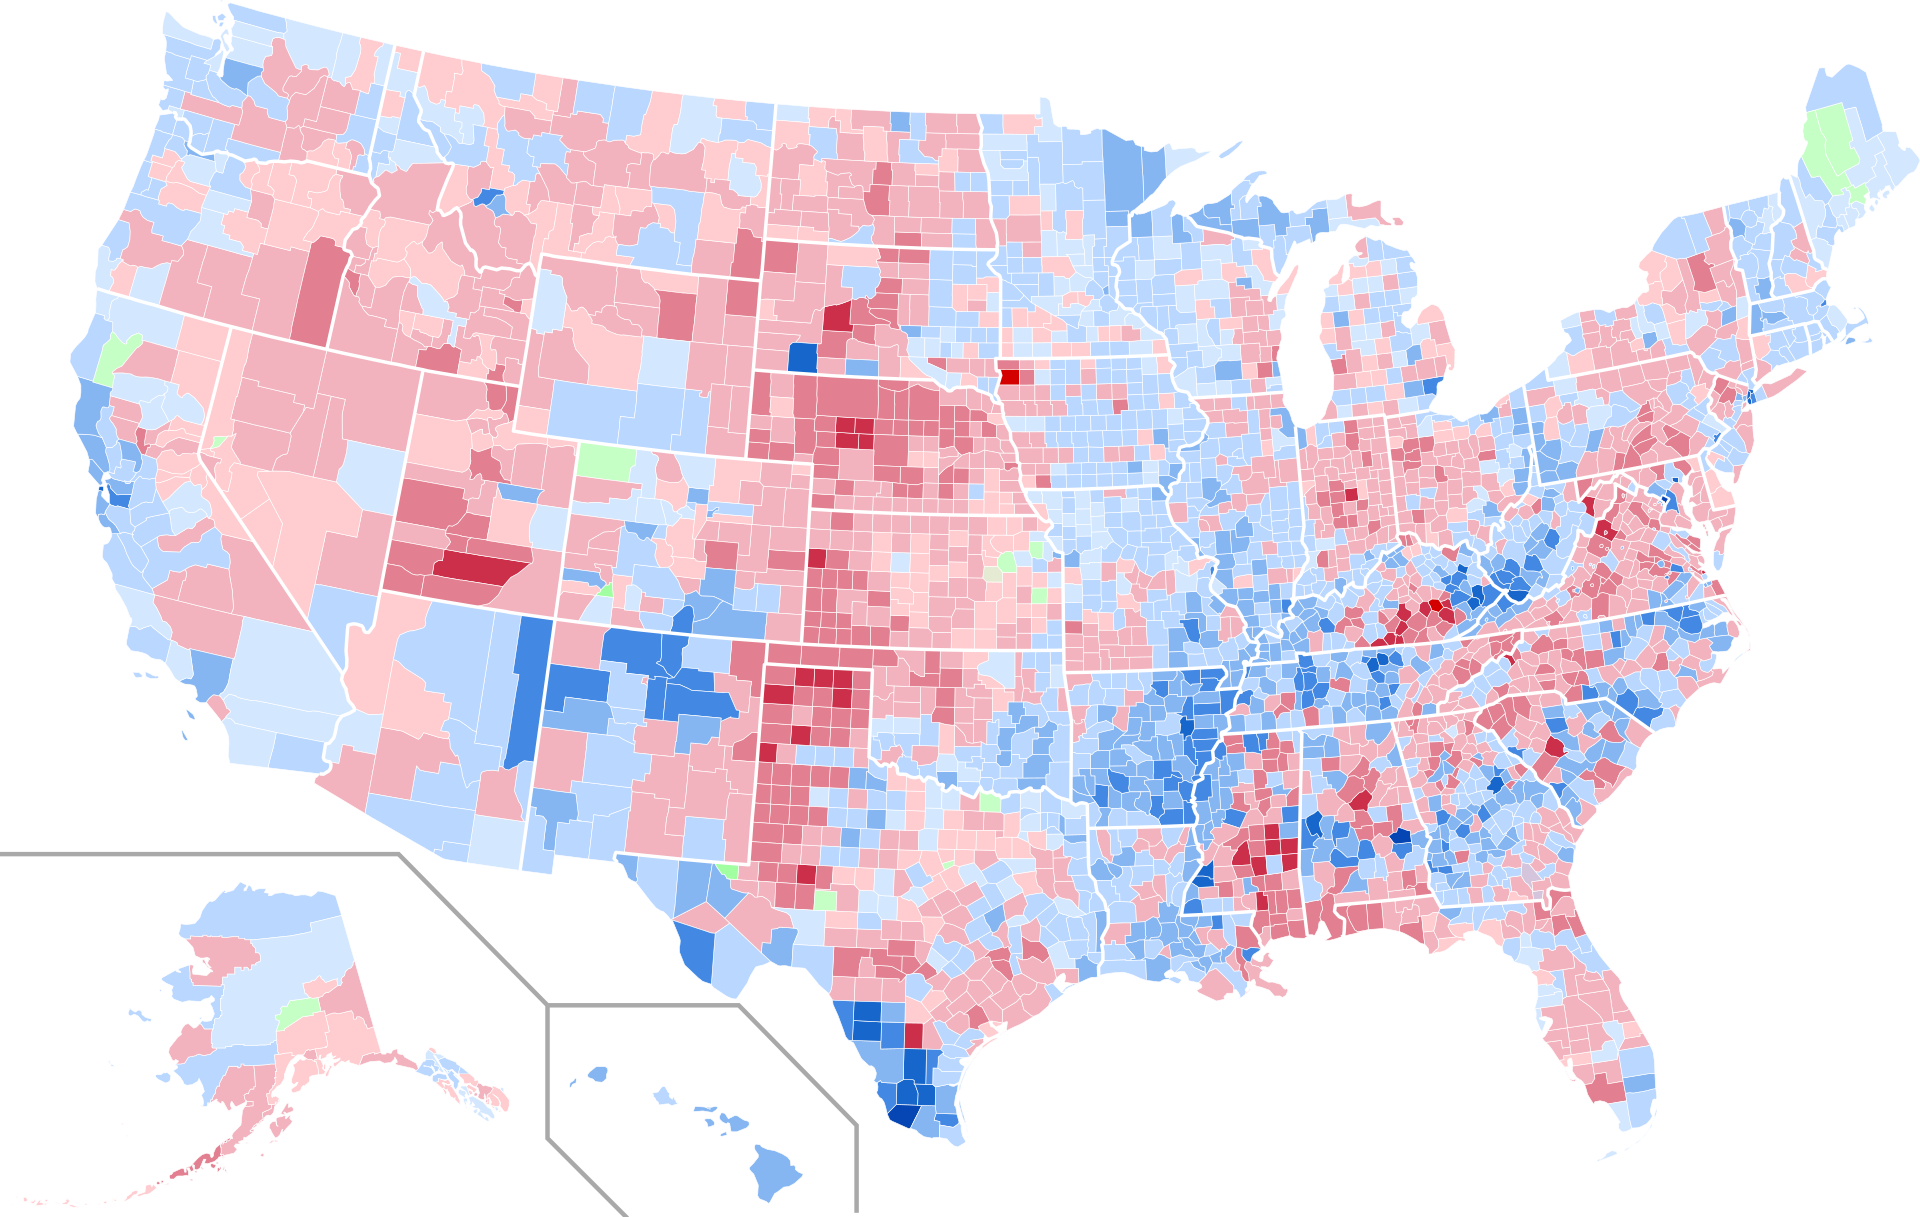
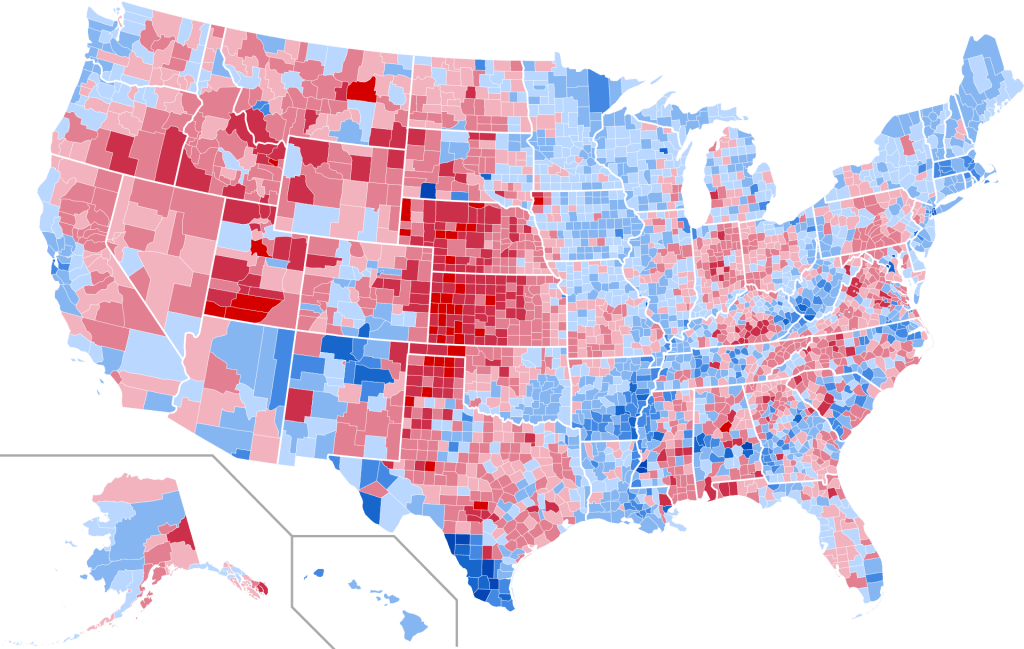
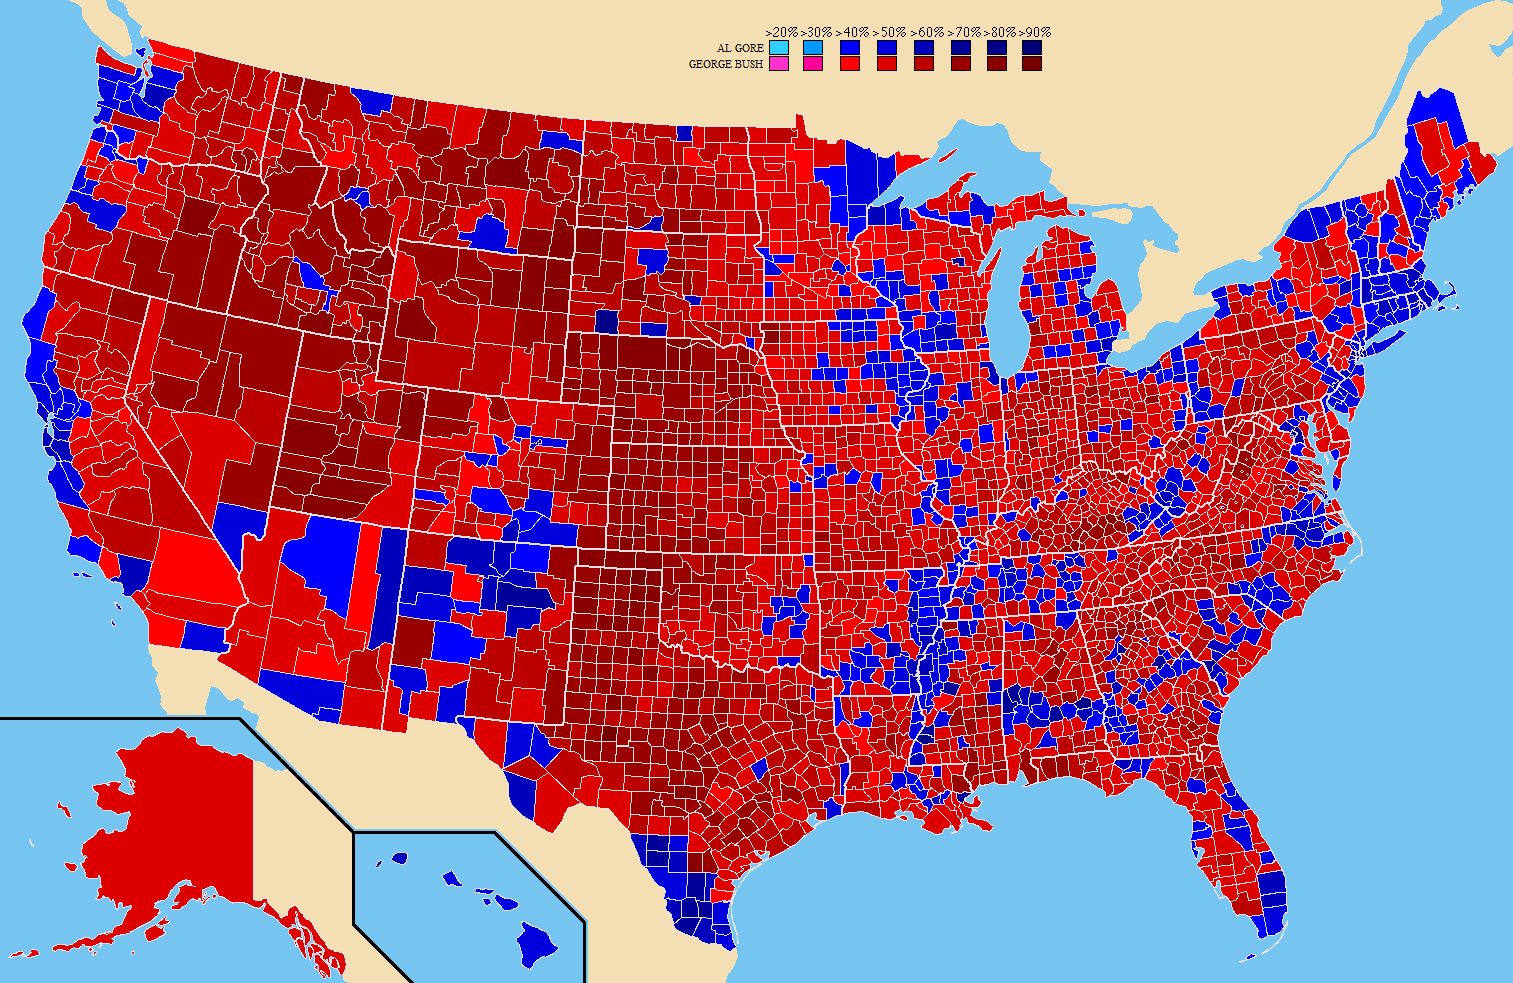
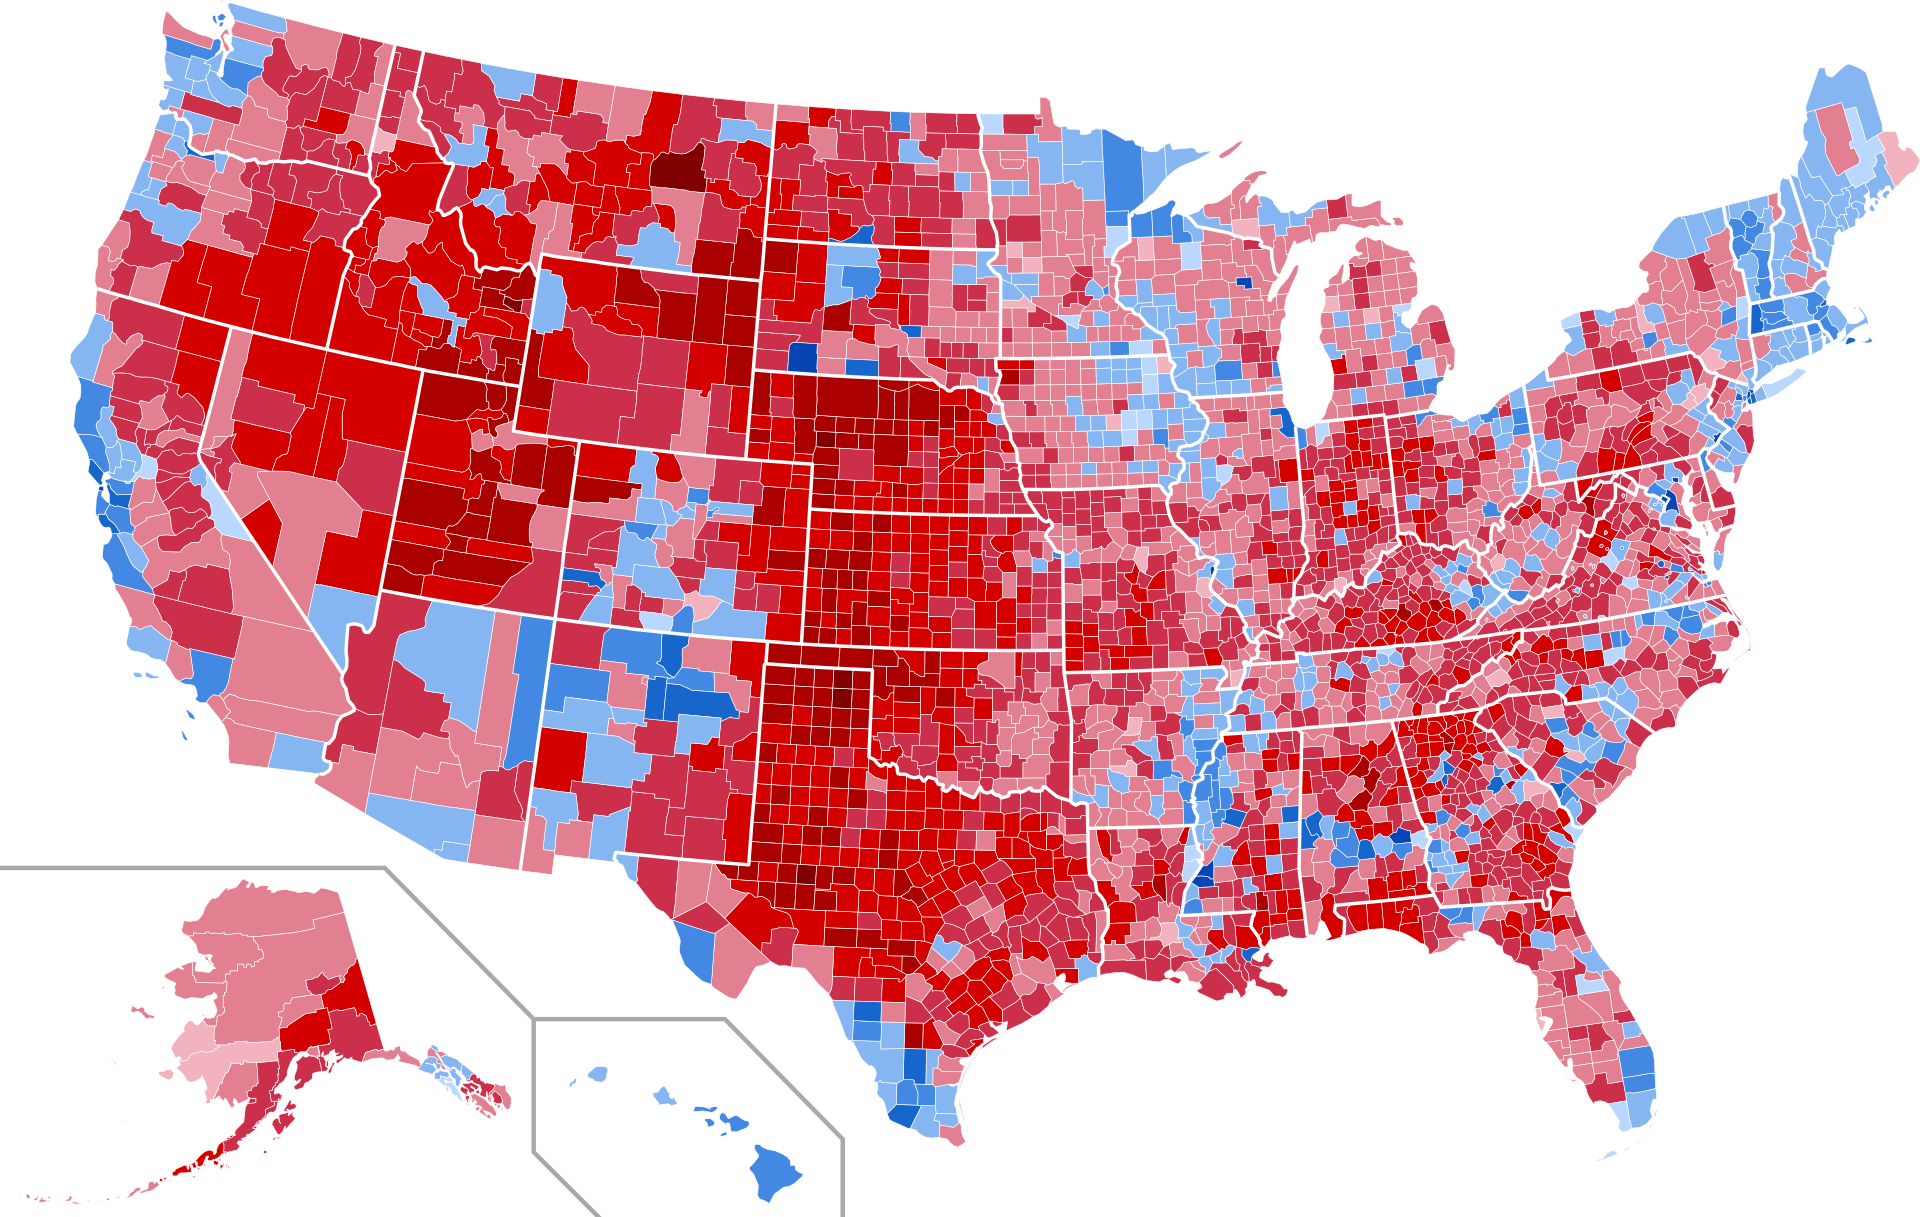
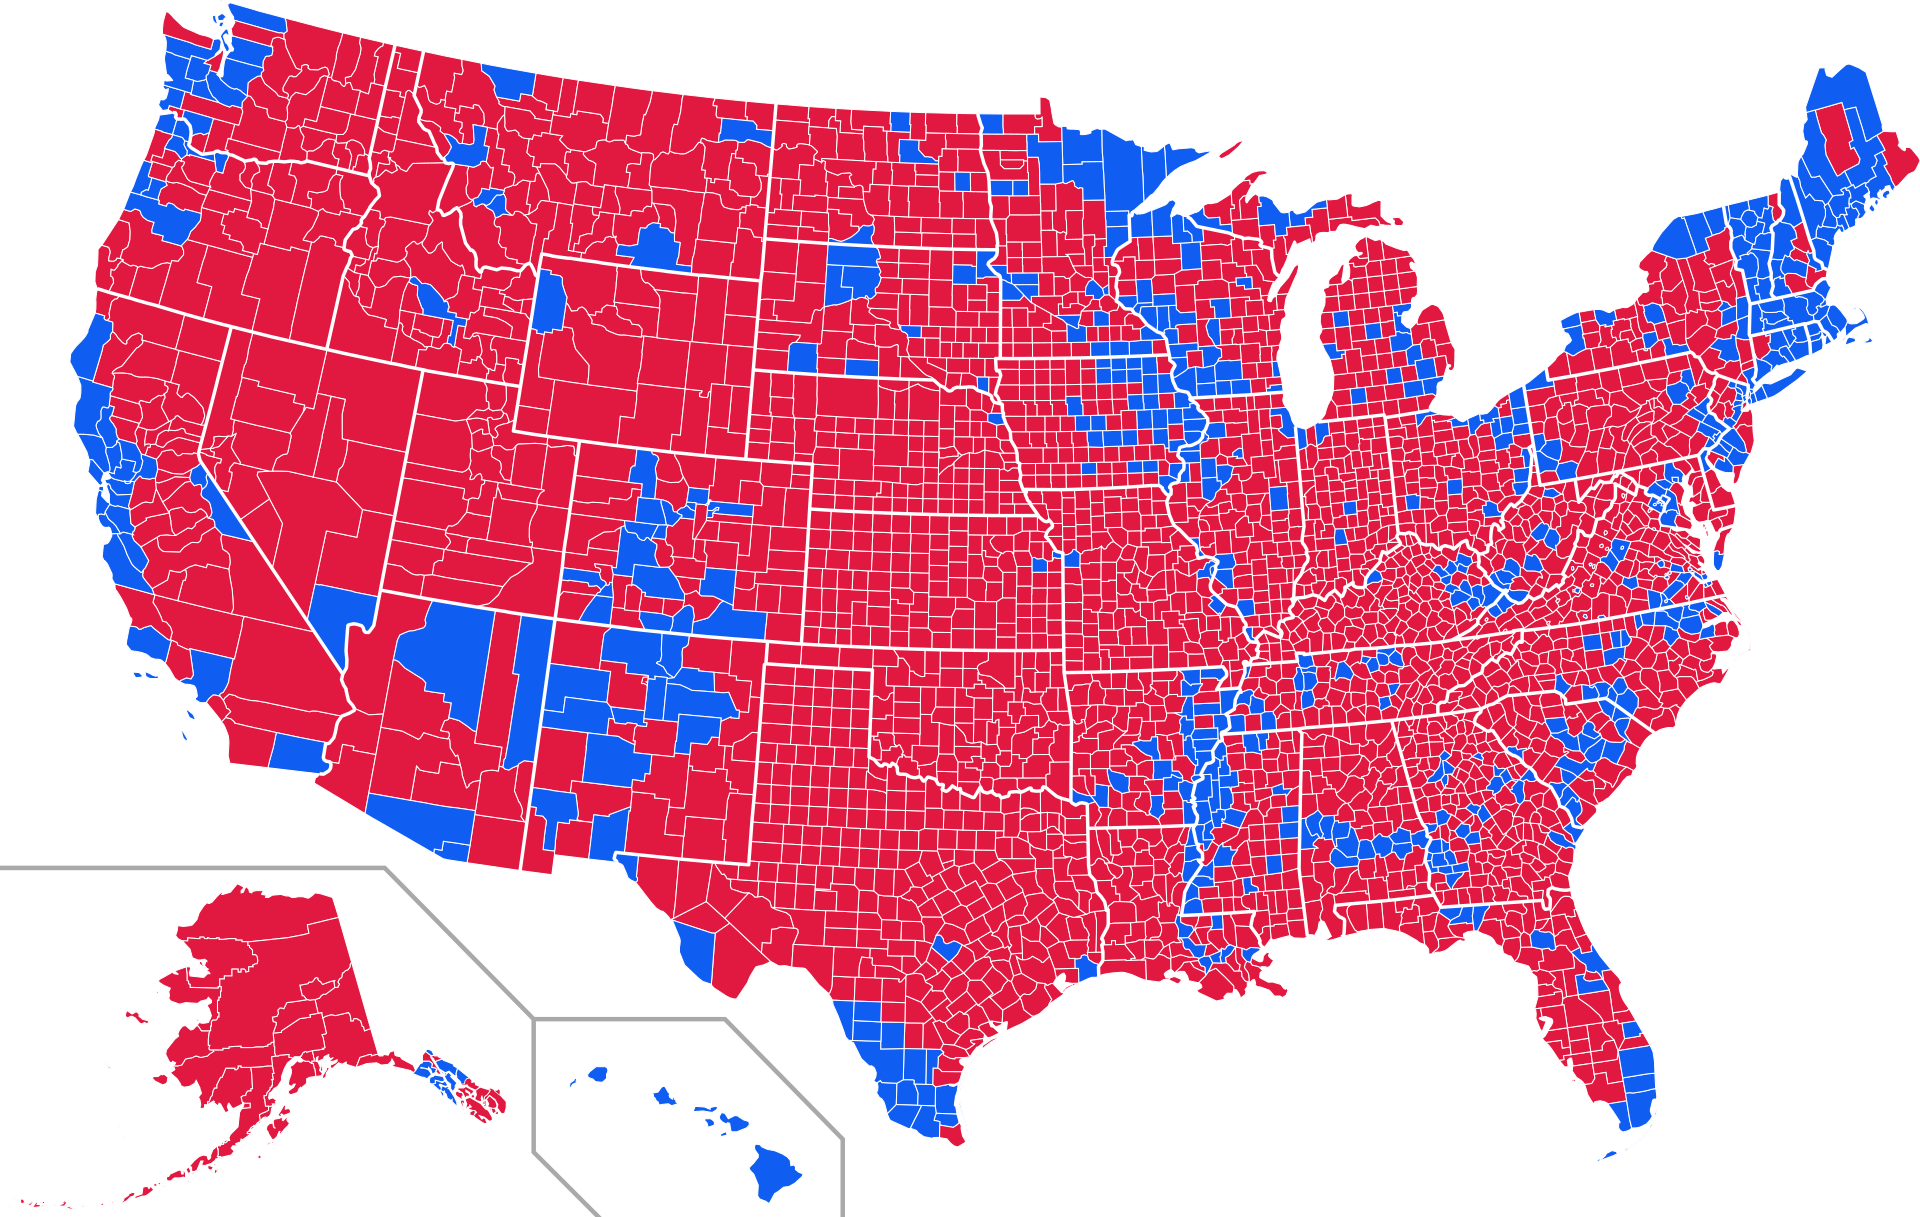
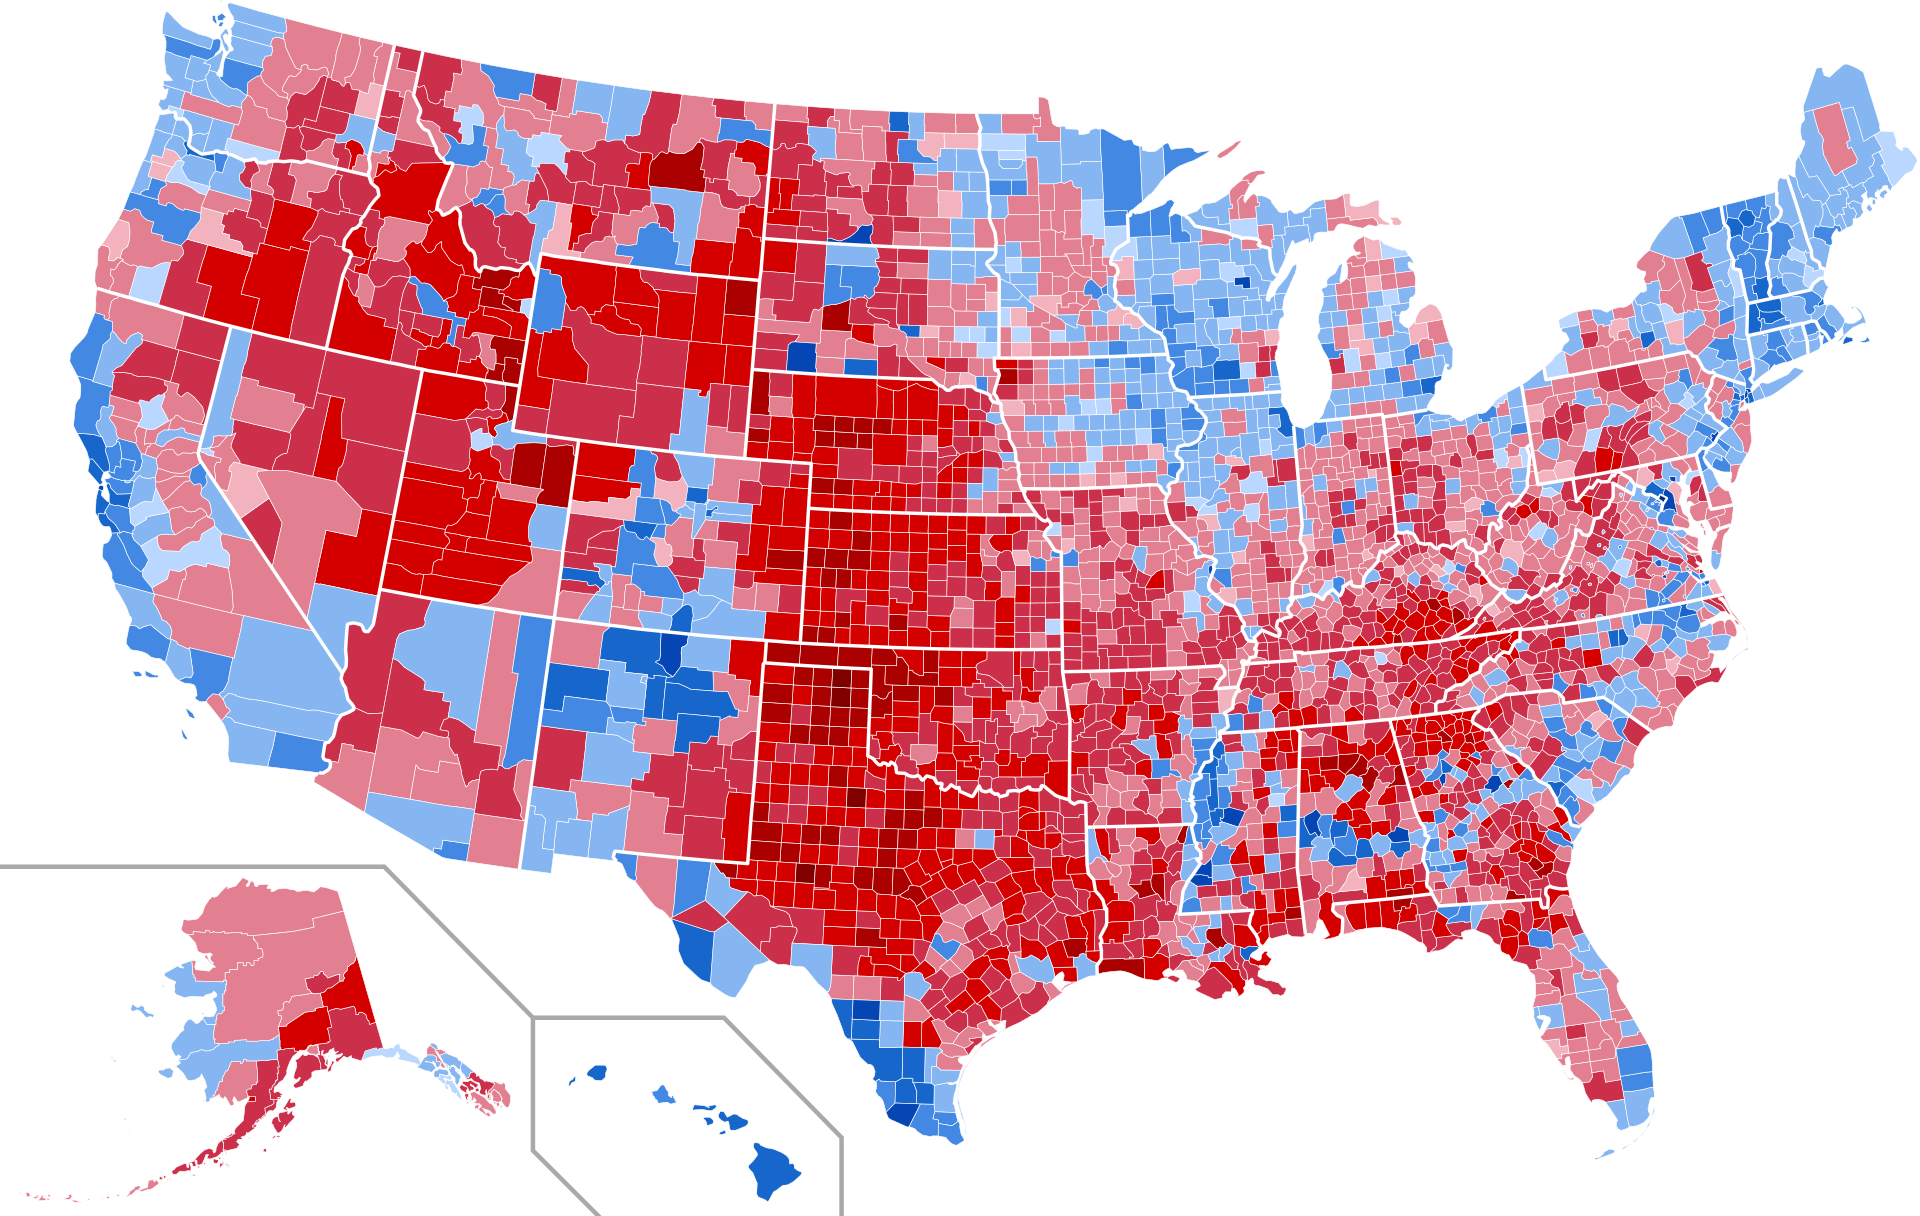
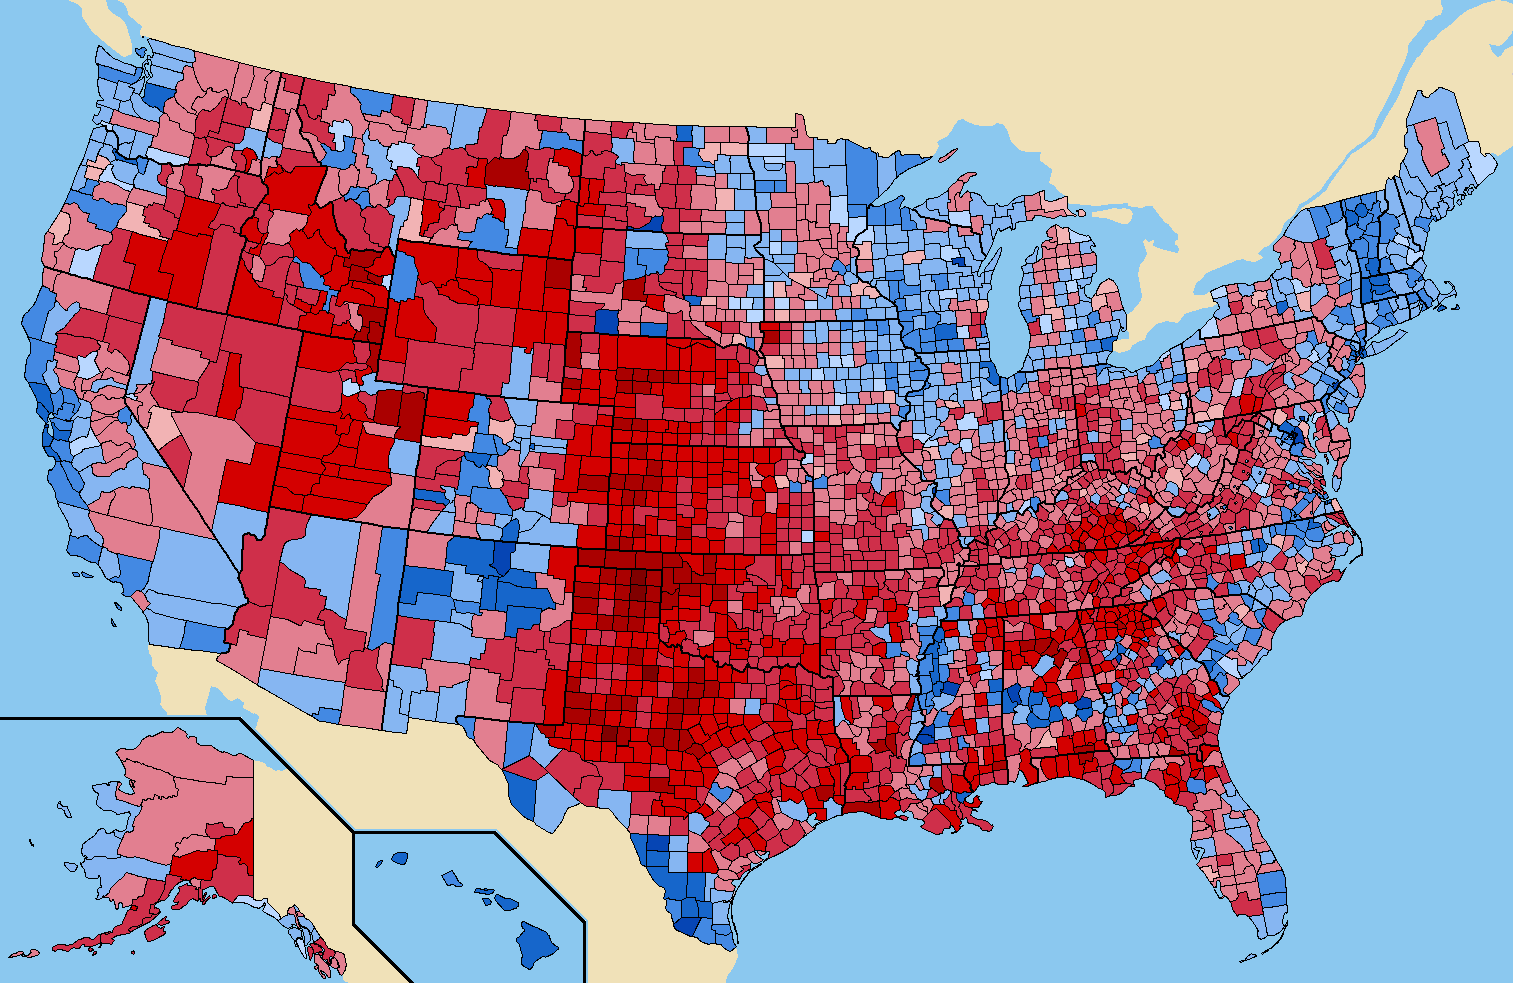
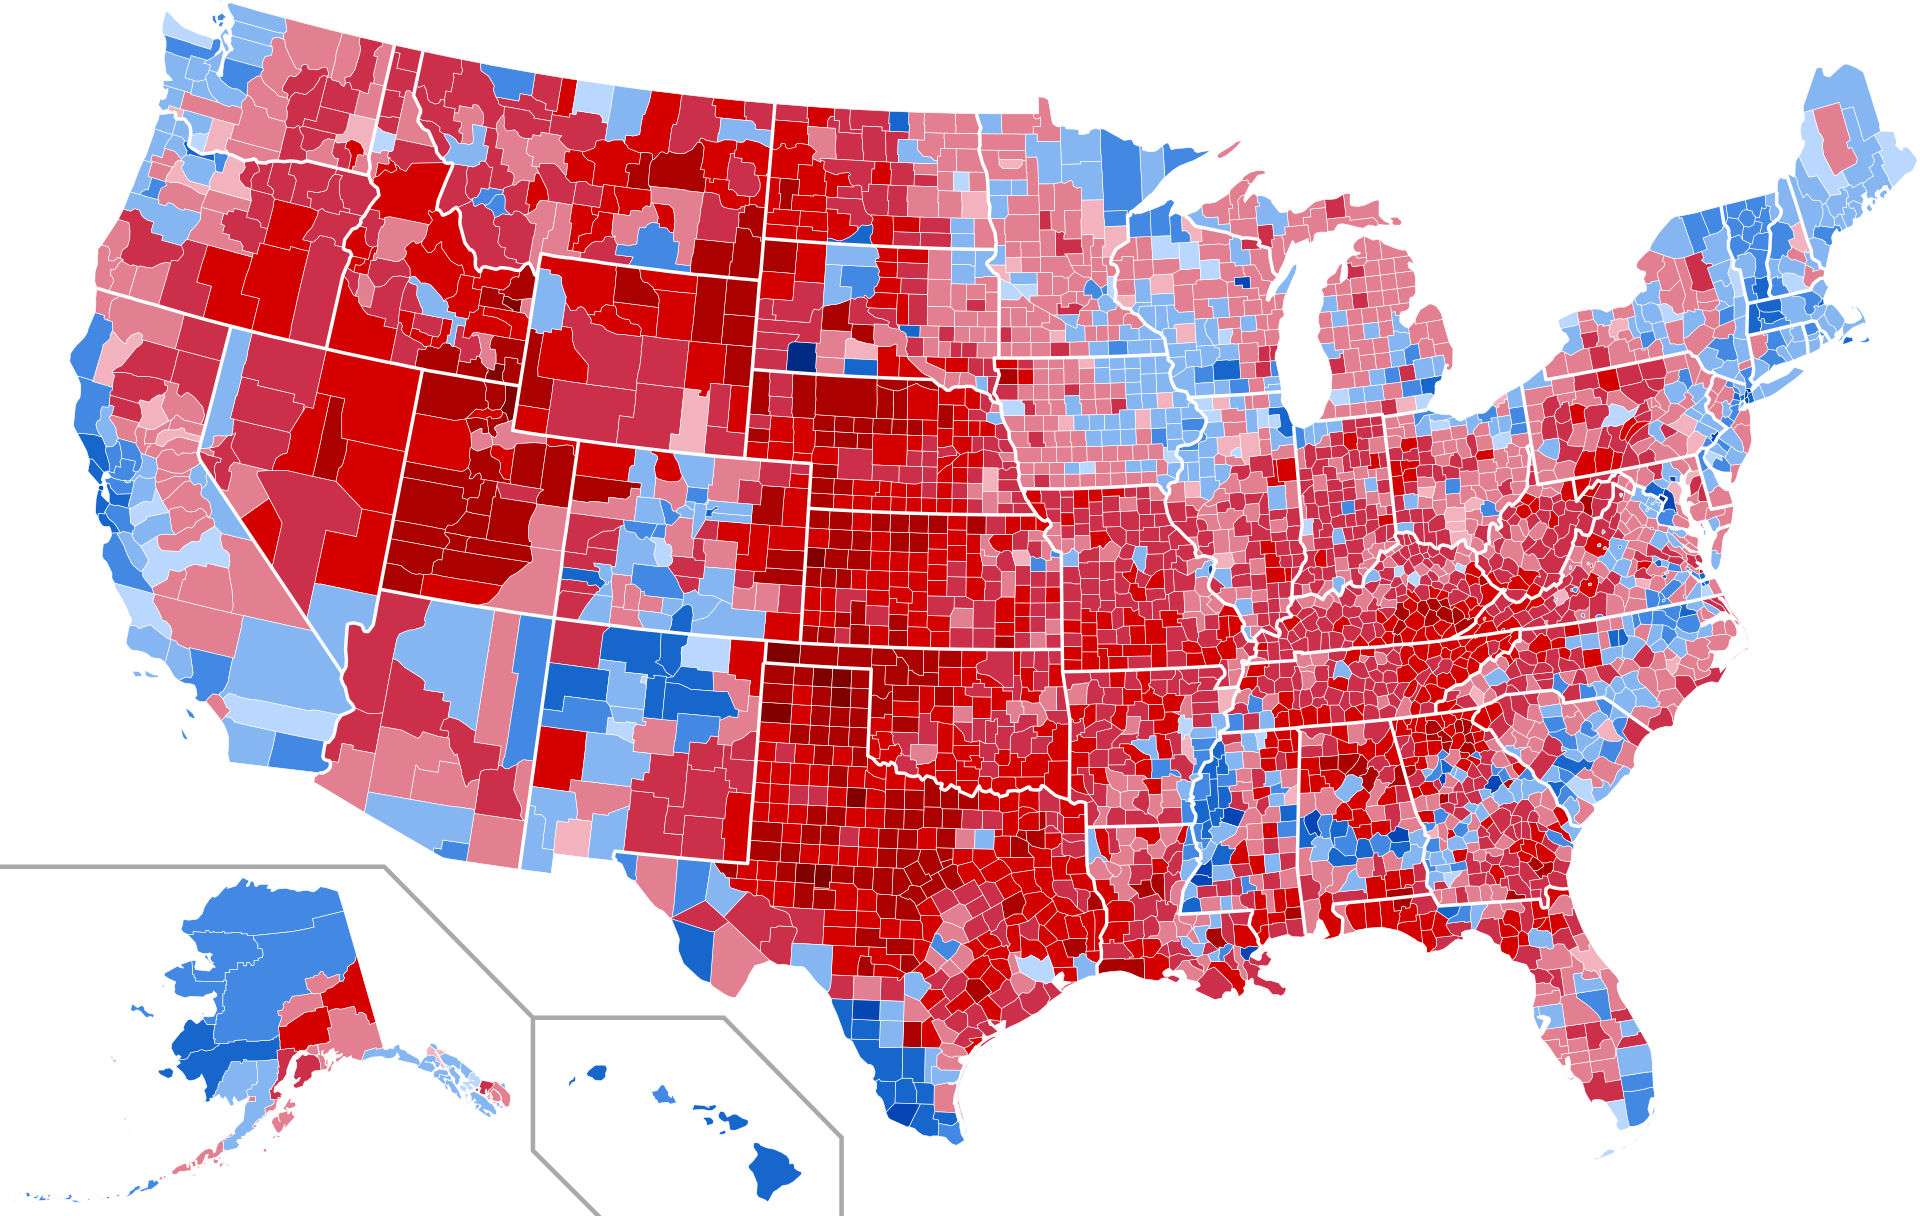
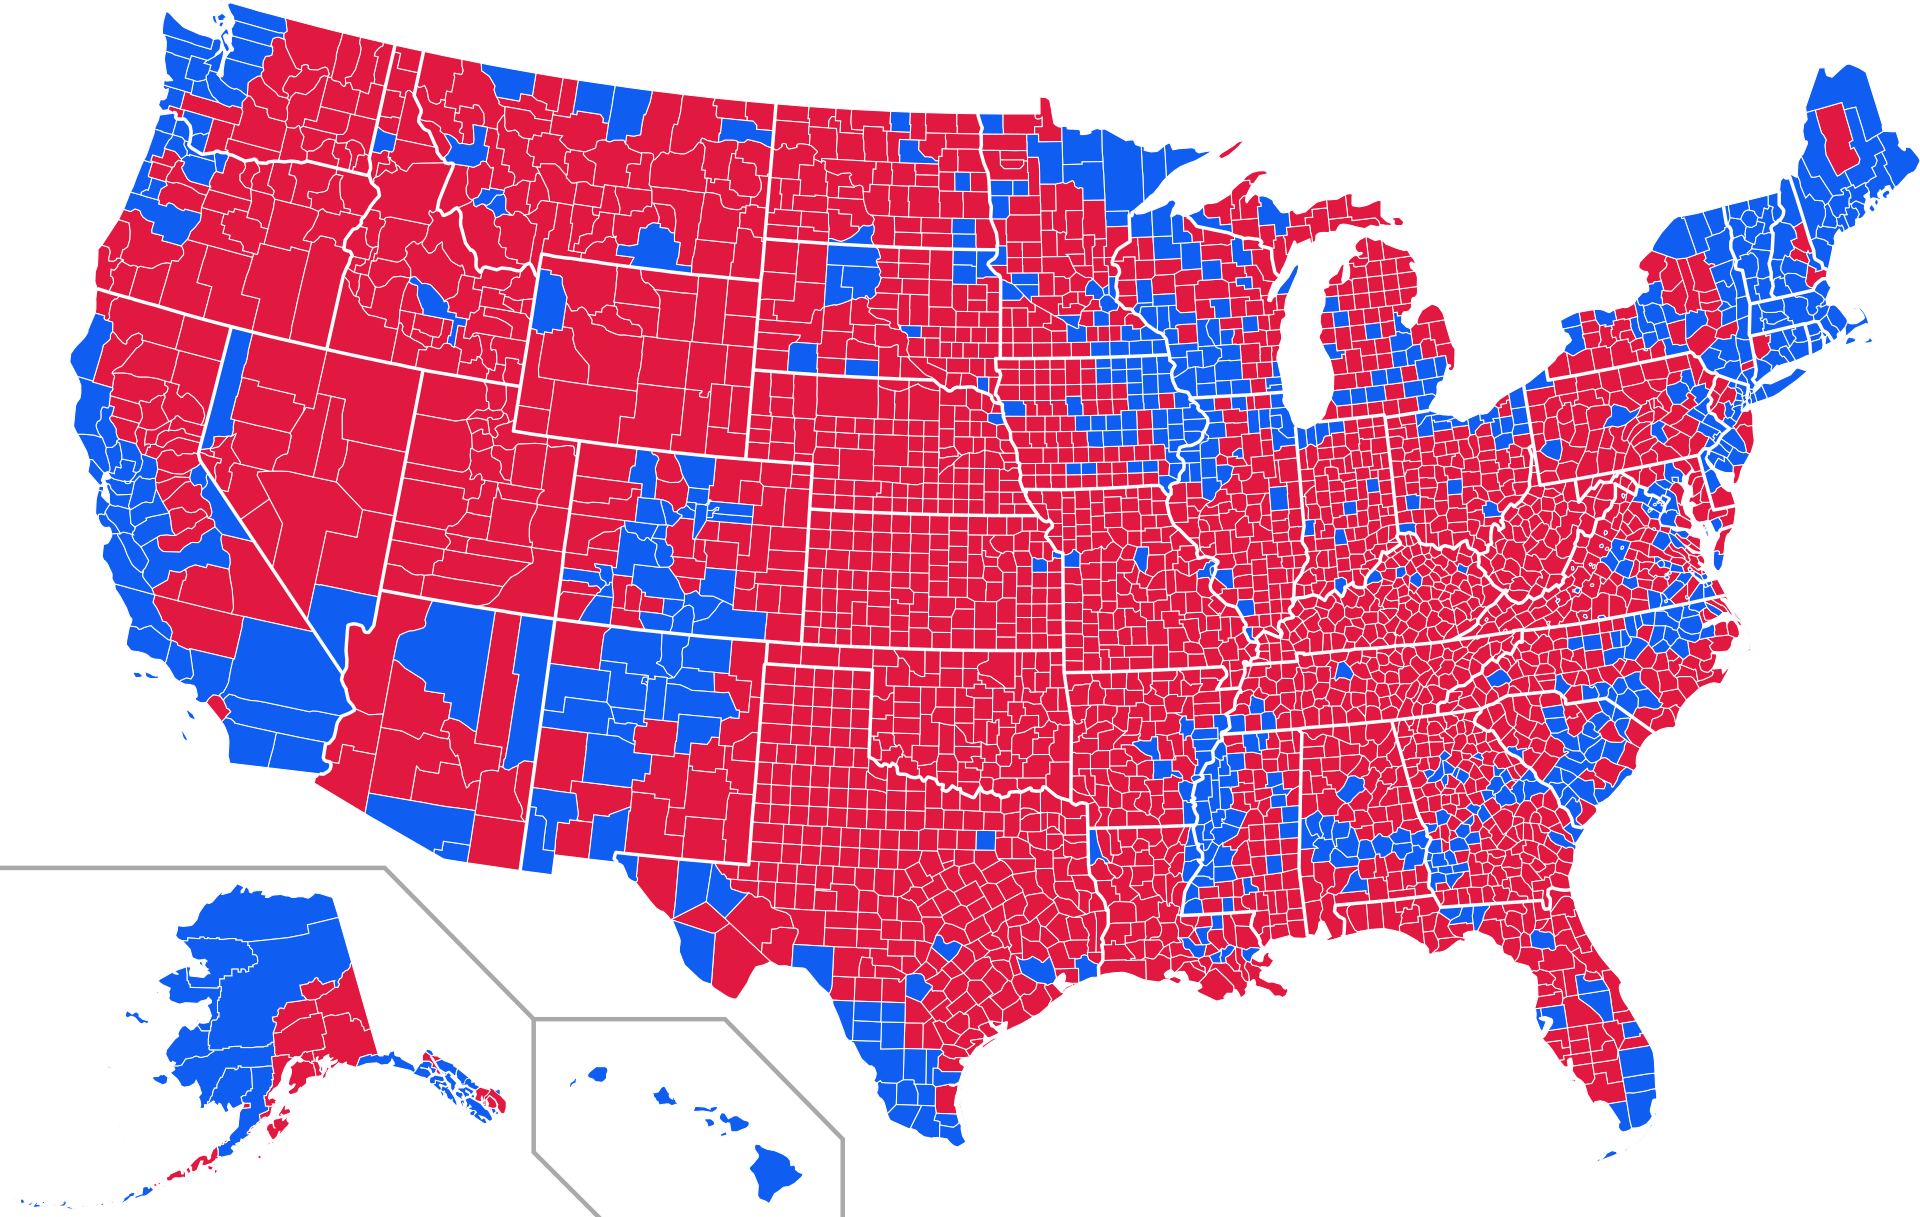
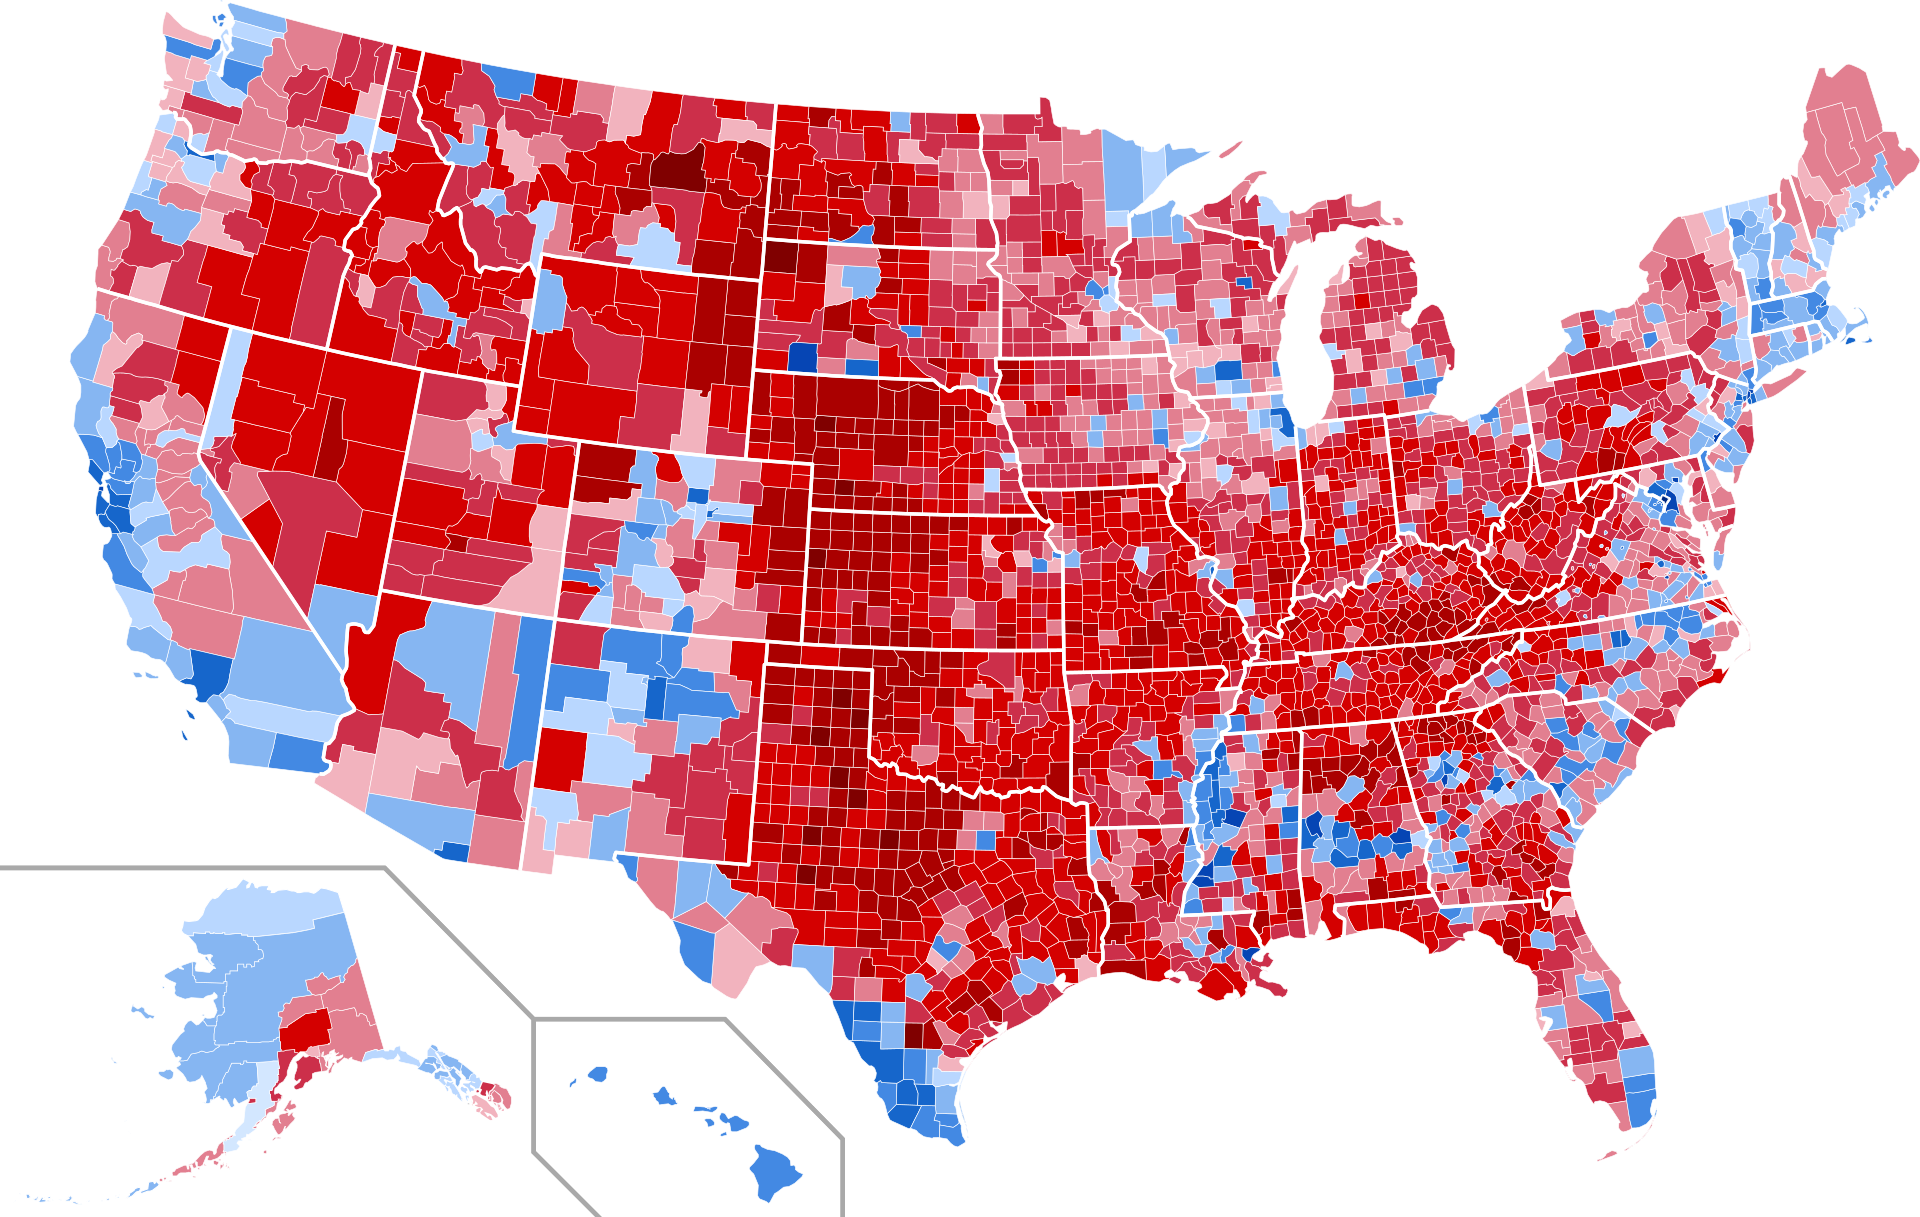
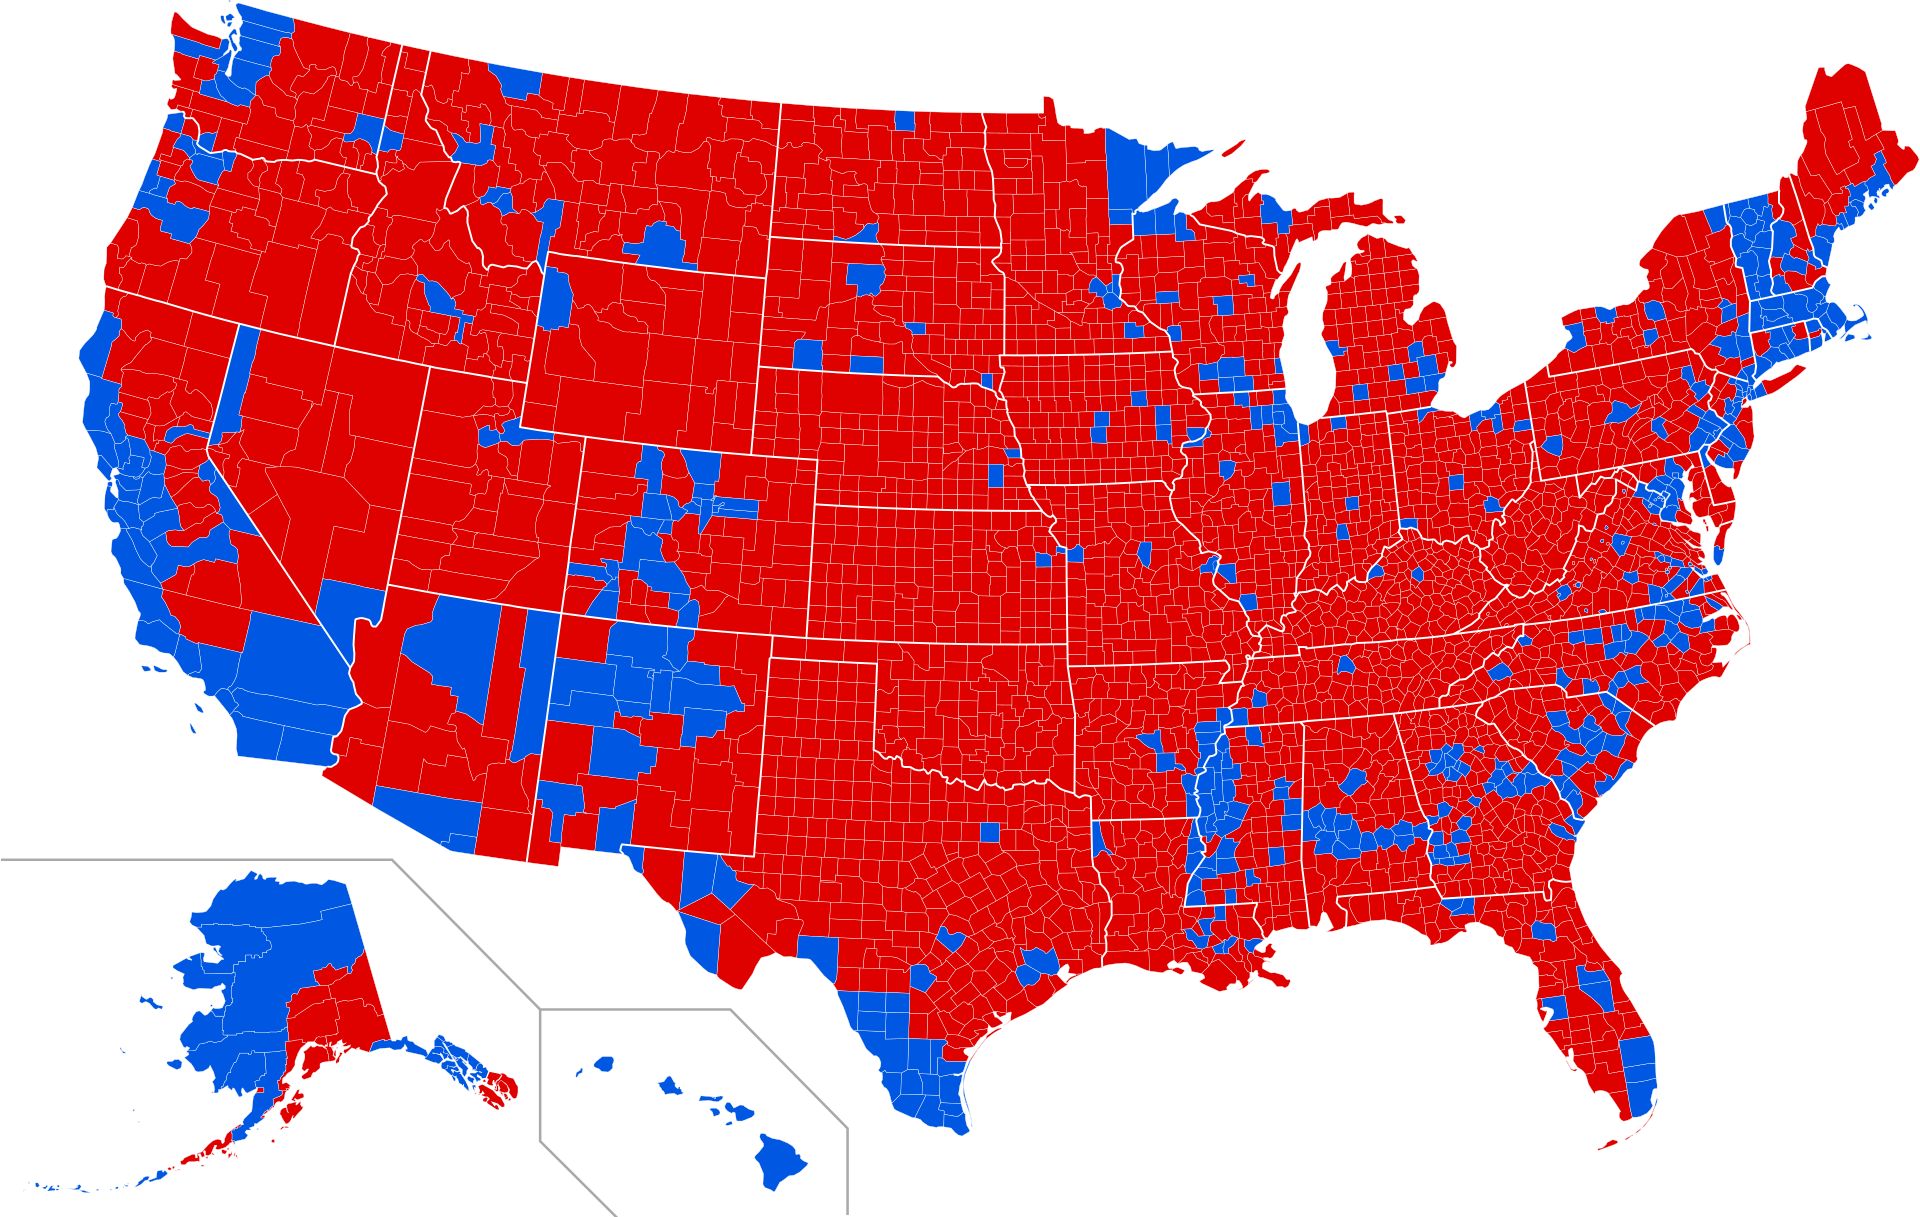
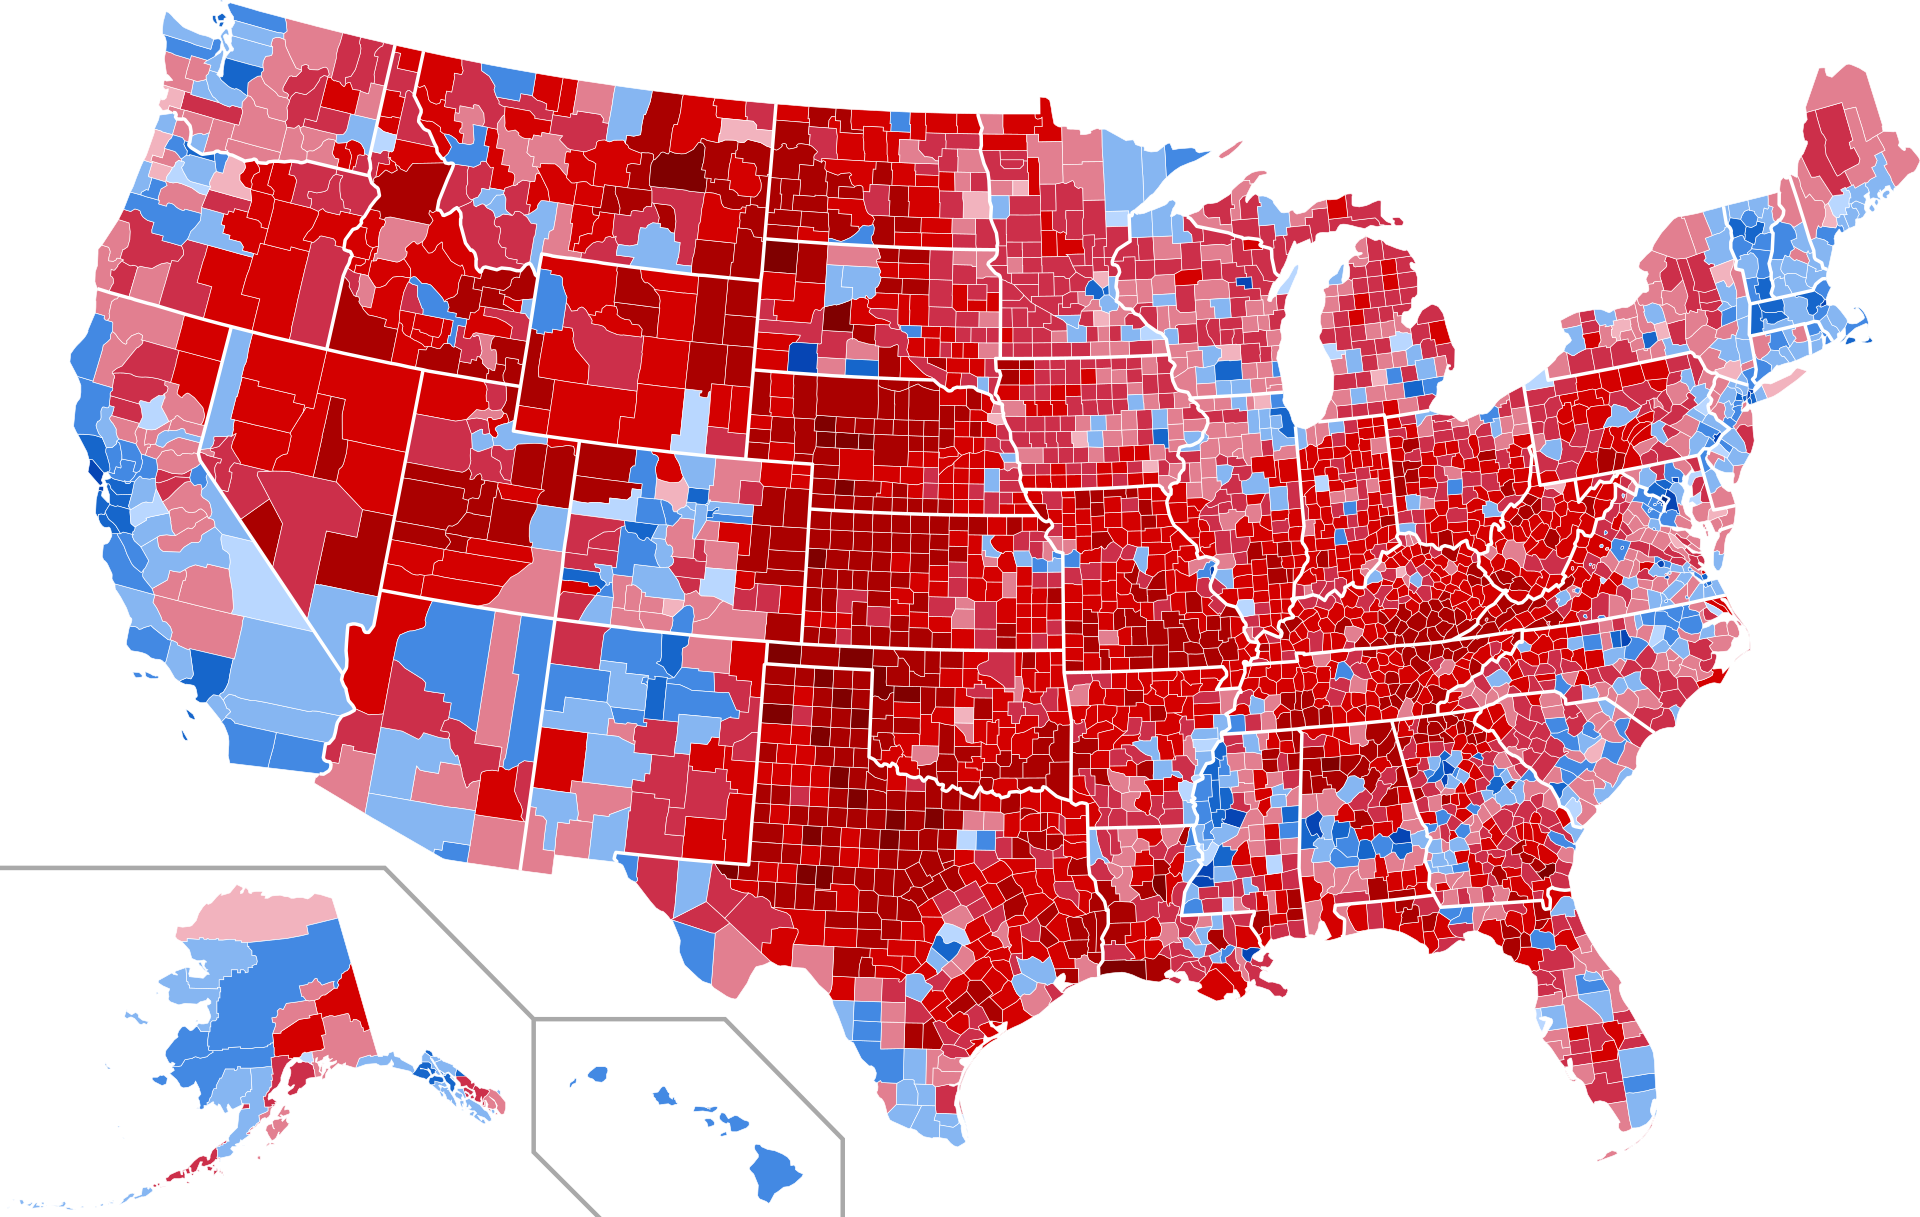
Below is a graphical representation of popular voting trends over the last 40 years; my how things have changed in our society, culture and political scene in 40 years. On the left is results by county, shaded according to winning candidate’s percentage of the vote and on the right is the results by county. Some years didn’t have both to compare so I inserted the one they had.
I got all of these graphics from Wikipedia using this link and simply changing the year in the link. If you happen to be using WordPress Reader to view this blog, the graphic comparison sliders will only work in the HTML version of the blog post.
1980
85,104,195 Voters
Reagan 50.7%, Carter 41.0%, Anderson 6.6%
(Reagan Wins Electoral College)
1984
92,032,824 Voters
Reagan 58.8%, Mondale 40.6%
(Reagan Wins Electoral College)
1988
90,696,073 Voters
Bush 53.4%, Dukakis 45.6%
(Bush Wind Electoral College)
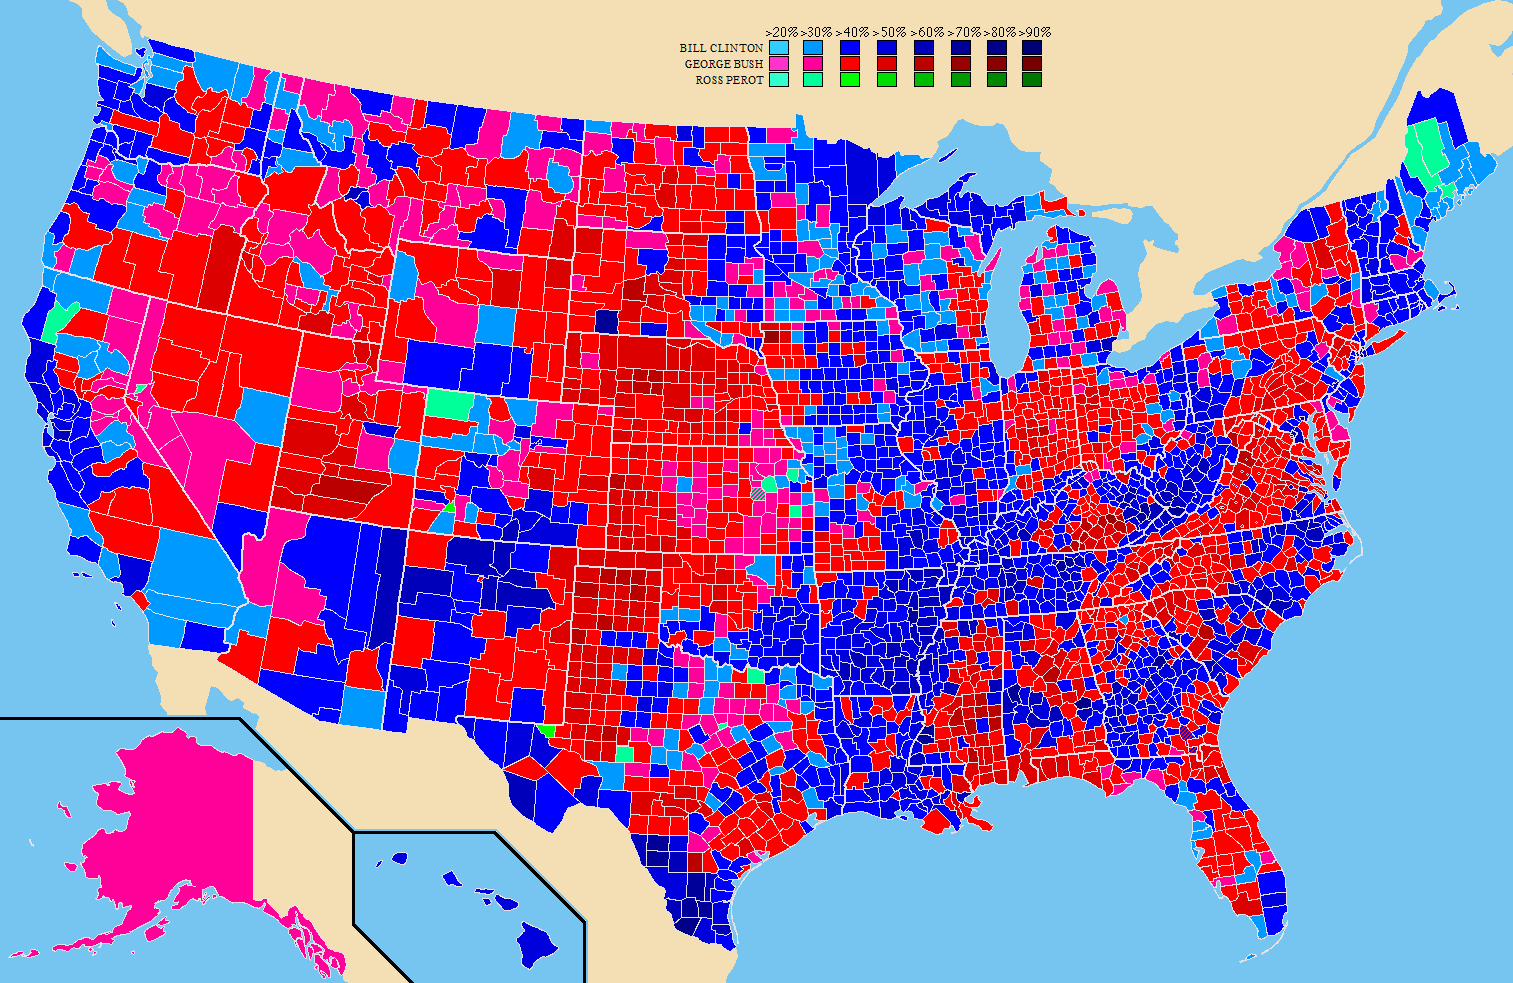
1992
103,758,260 Voters
Clinton 43.0%, Bush 37.4%, Perot 18.9%
(Clinton Wins Electoral College)
1996
94,683,948 Voters
Clinton 49.2%, Dole 40.7%, Perot 8.4%
(Clinton Wins Electoral College)
2000
101,455,899 Voters
Bush 47.9%, Gore 48.4
(Bush Wins Electoral College)
2004
121,069,054 Voters
Bush 50.7%, Kerry 48.3%
(Bush Wins Electoral College)
2008
129,446,839 Voters
Obama 52.9%, McCain 45.7%
(Obama Wins Electoral College)
2012
126,849,299 Voters
Obama 51.1%, Romney 47.2%
(Obama Wins Electoral College)
2016
131,769,309 Voters
Trump 46.1%, Clinton 48.2%
(Trump Wins Electoral College)
2020
155,507,476 Voters
Biden 51.3%, Trump 46.8%
(Biden Wins Electoral College)

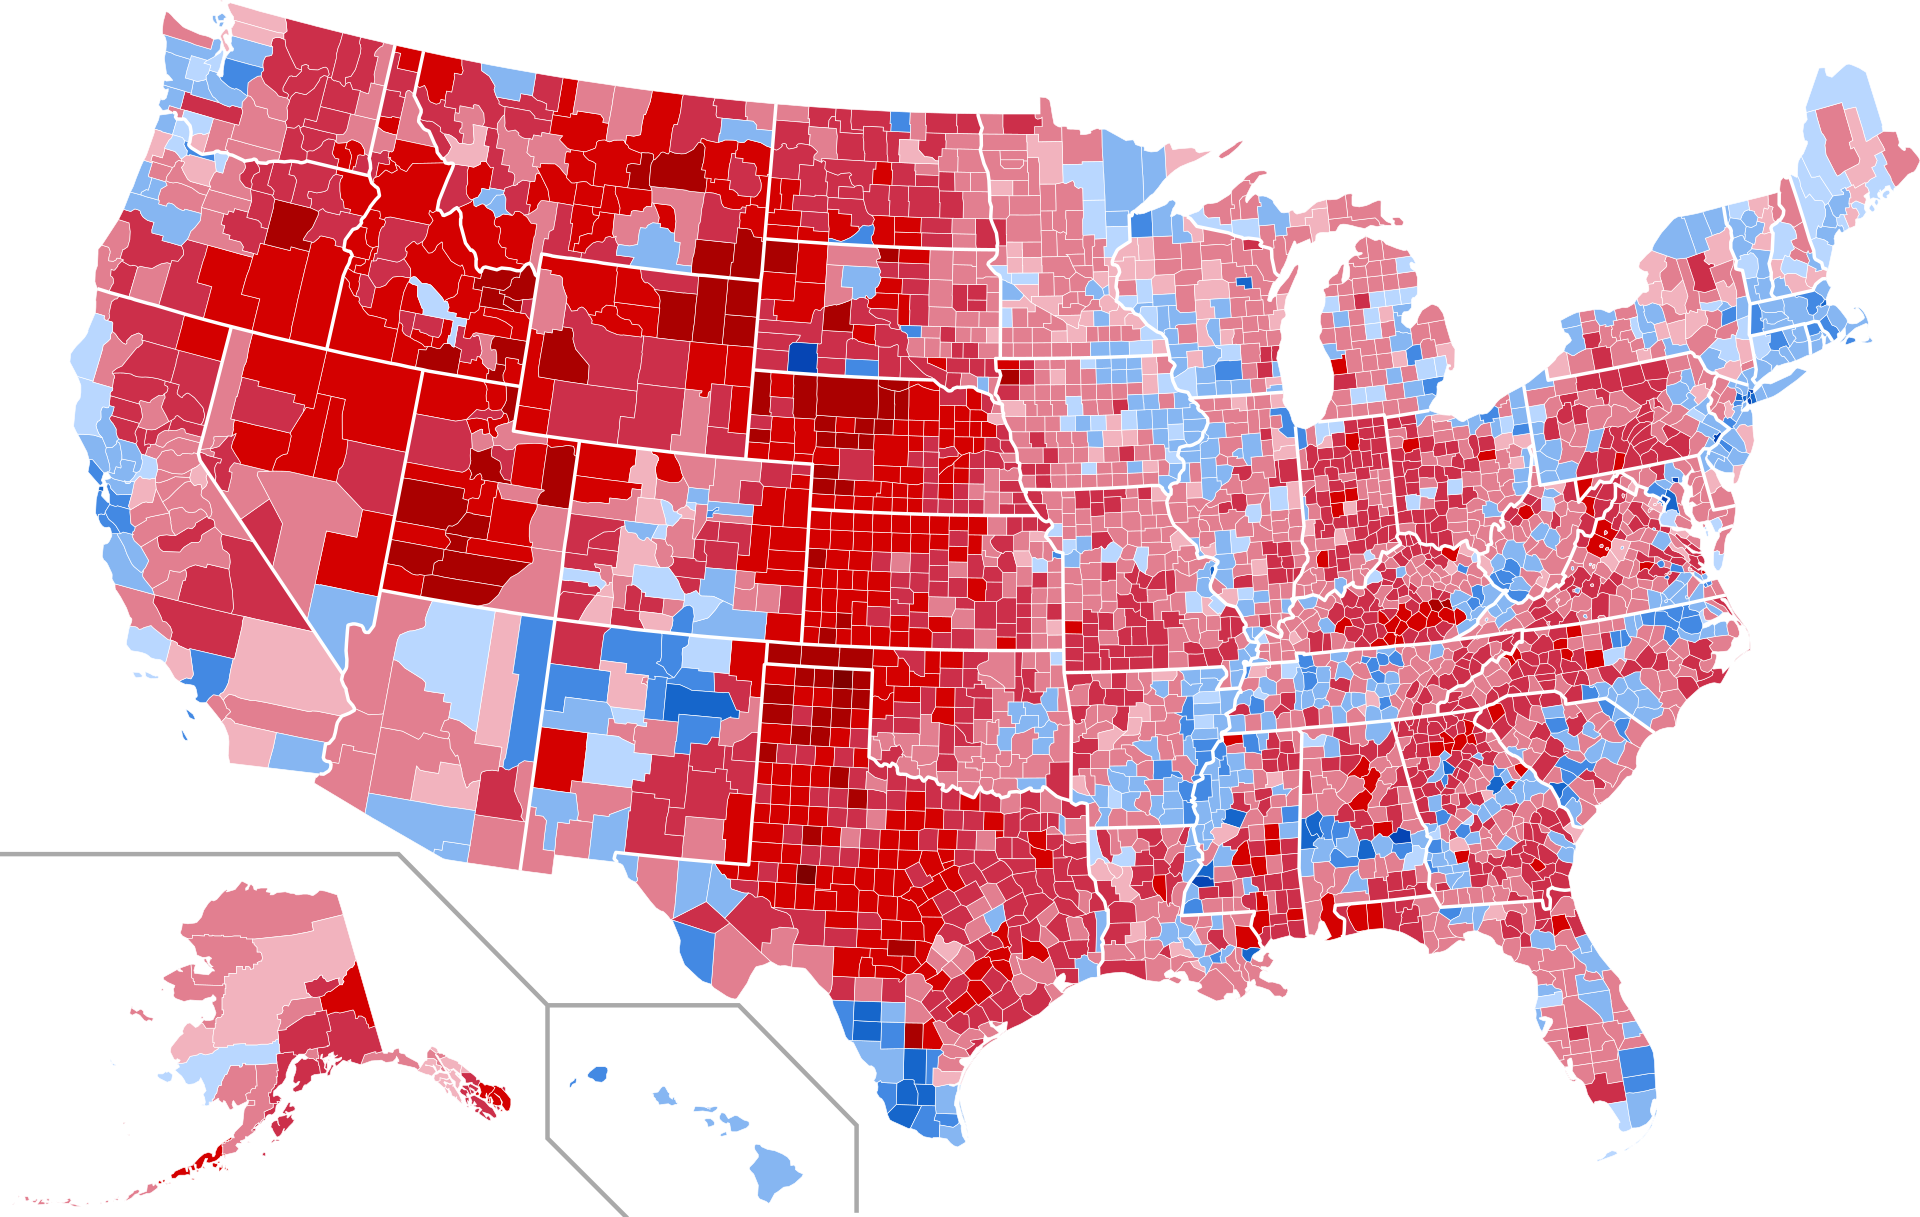
2024
150,079,929 Voters
Trump 50.1%, Harris 48.3%
(Trump Wins Electoral College)
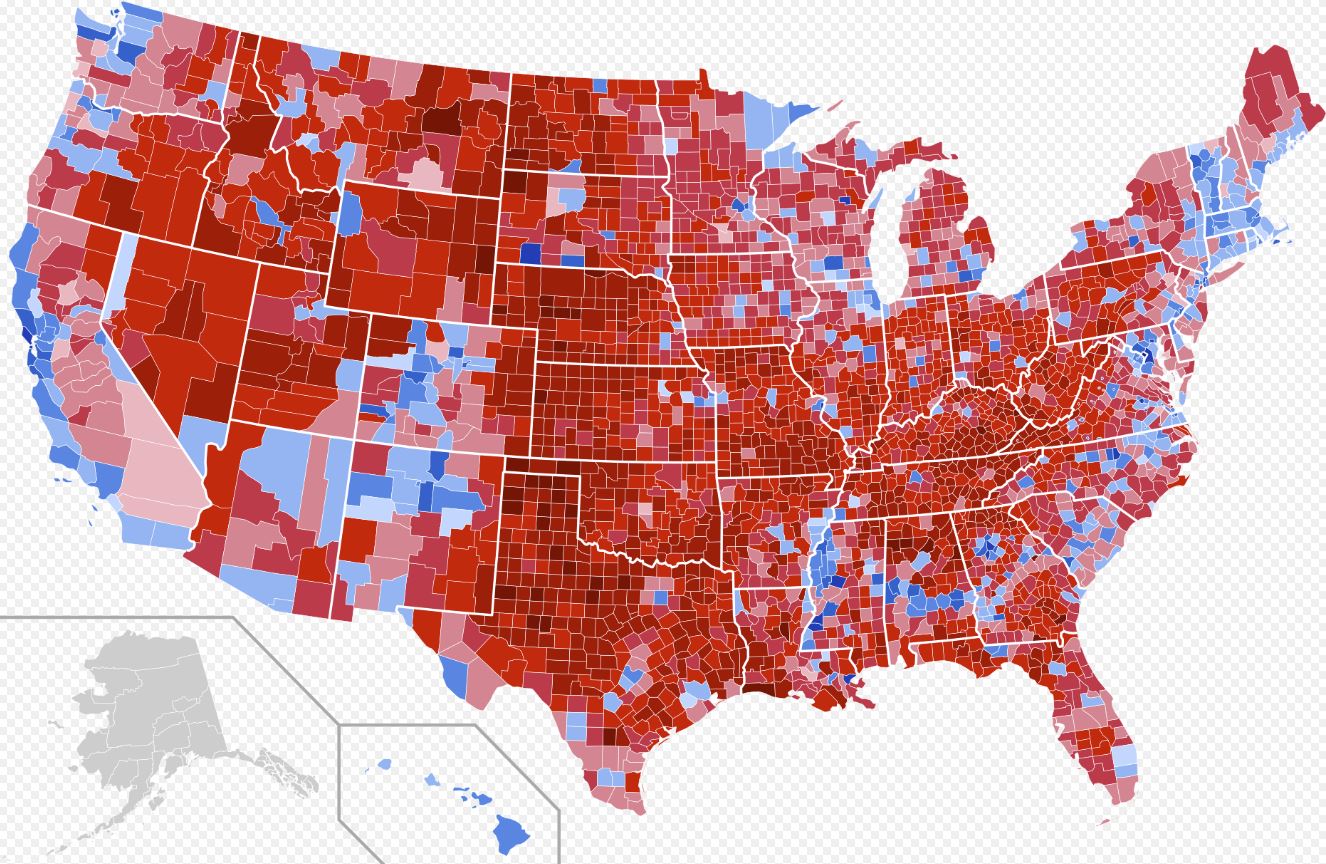
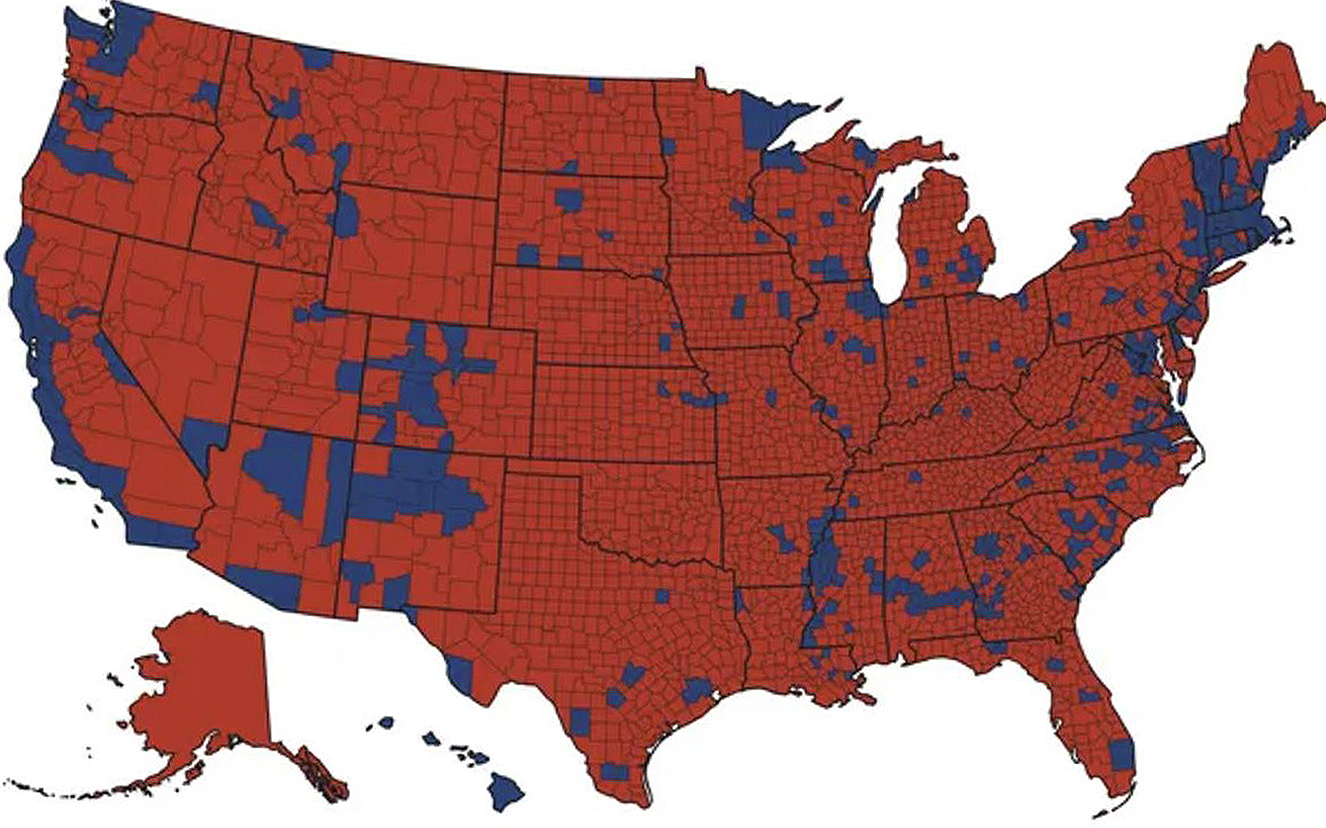
My observation on the pictorial representations of the United States geographical voting patterns is that it’s not very hard to see the swinging of the partisan political pendulum in those graphics.
Here are some numbers on votes cast based on what I found on Wikipedia for these Presidential elections.
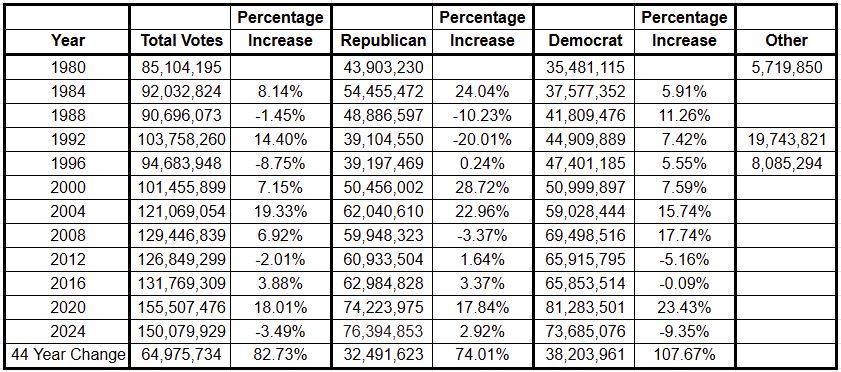
My observation on the spreadsheet calculations is that the Democratic Party has done a much better job at getting their base out to the polls to vote than the Republicans. Look at that 44 year increase in voter turnout, 108% increase for the Democrats and only 74% increase for Republicans. I’m glad that we’ve had a 83% overall increase in voters over the last 44 years but that is NOT enough, we really need over an 80% (preferably over 90%) voter turnout of eligible legal voters to really access the direction the general population wants to steer the country. We can and we must do better!
Below is a graphic of a spreadsheet containing vote totals for each state for the 2016, 2020, and 2024 Presidential elections. I have included the increase in vote totals for each state, the values in red are negative increases aka decrease in votes.
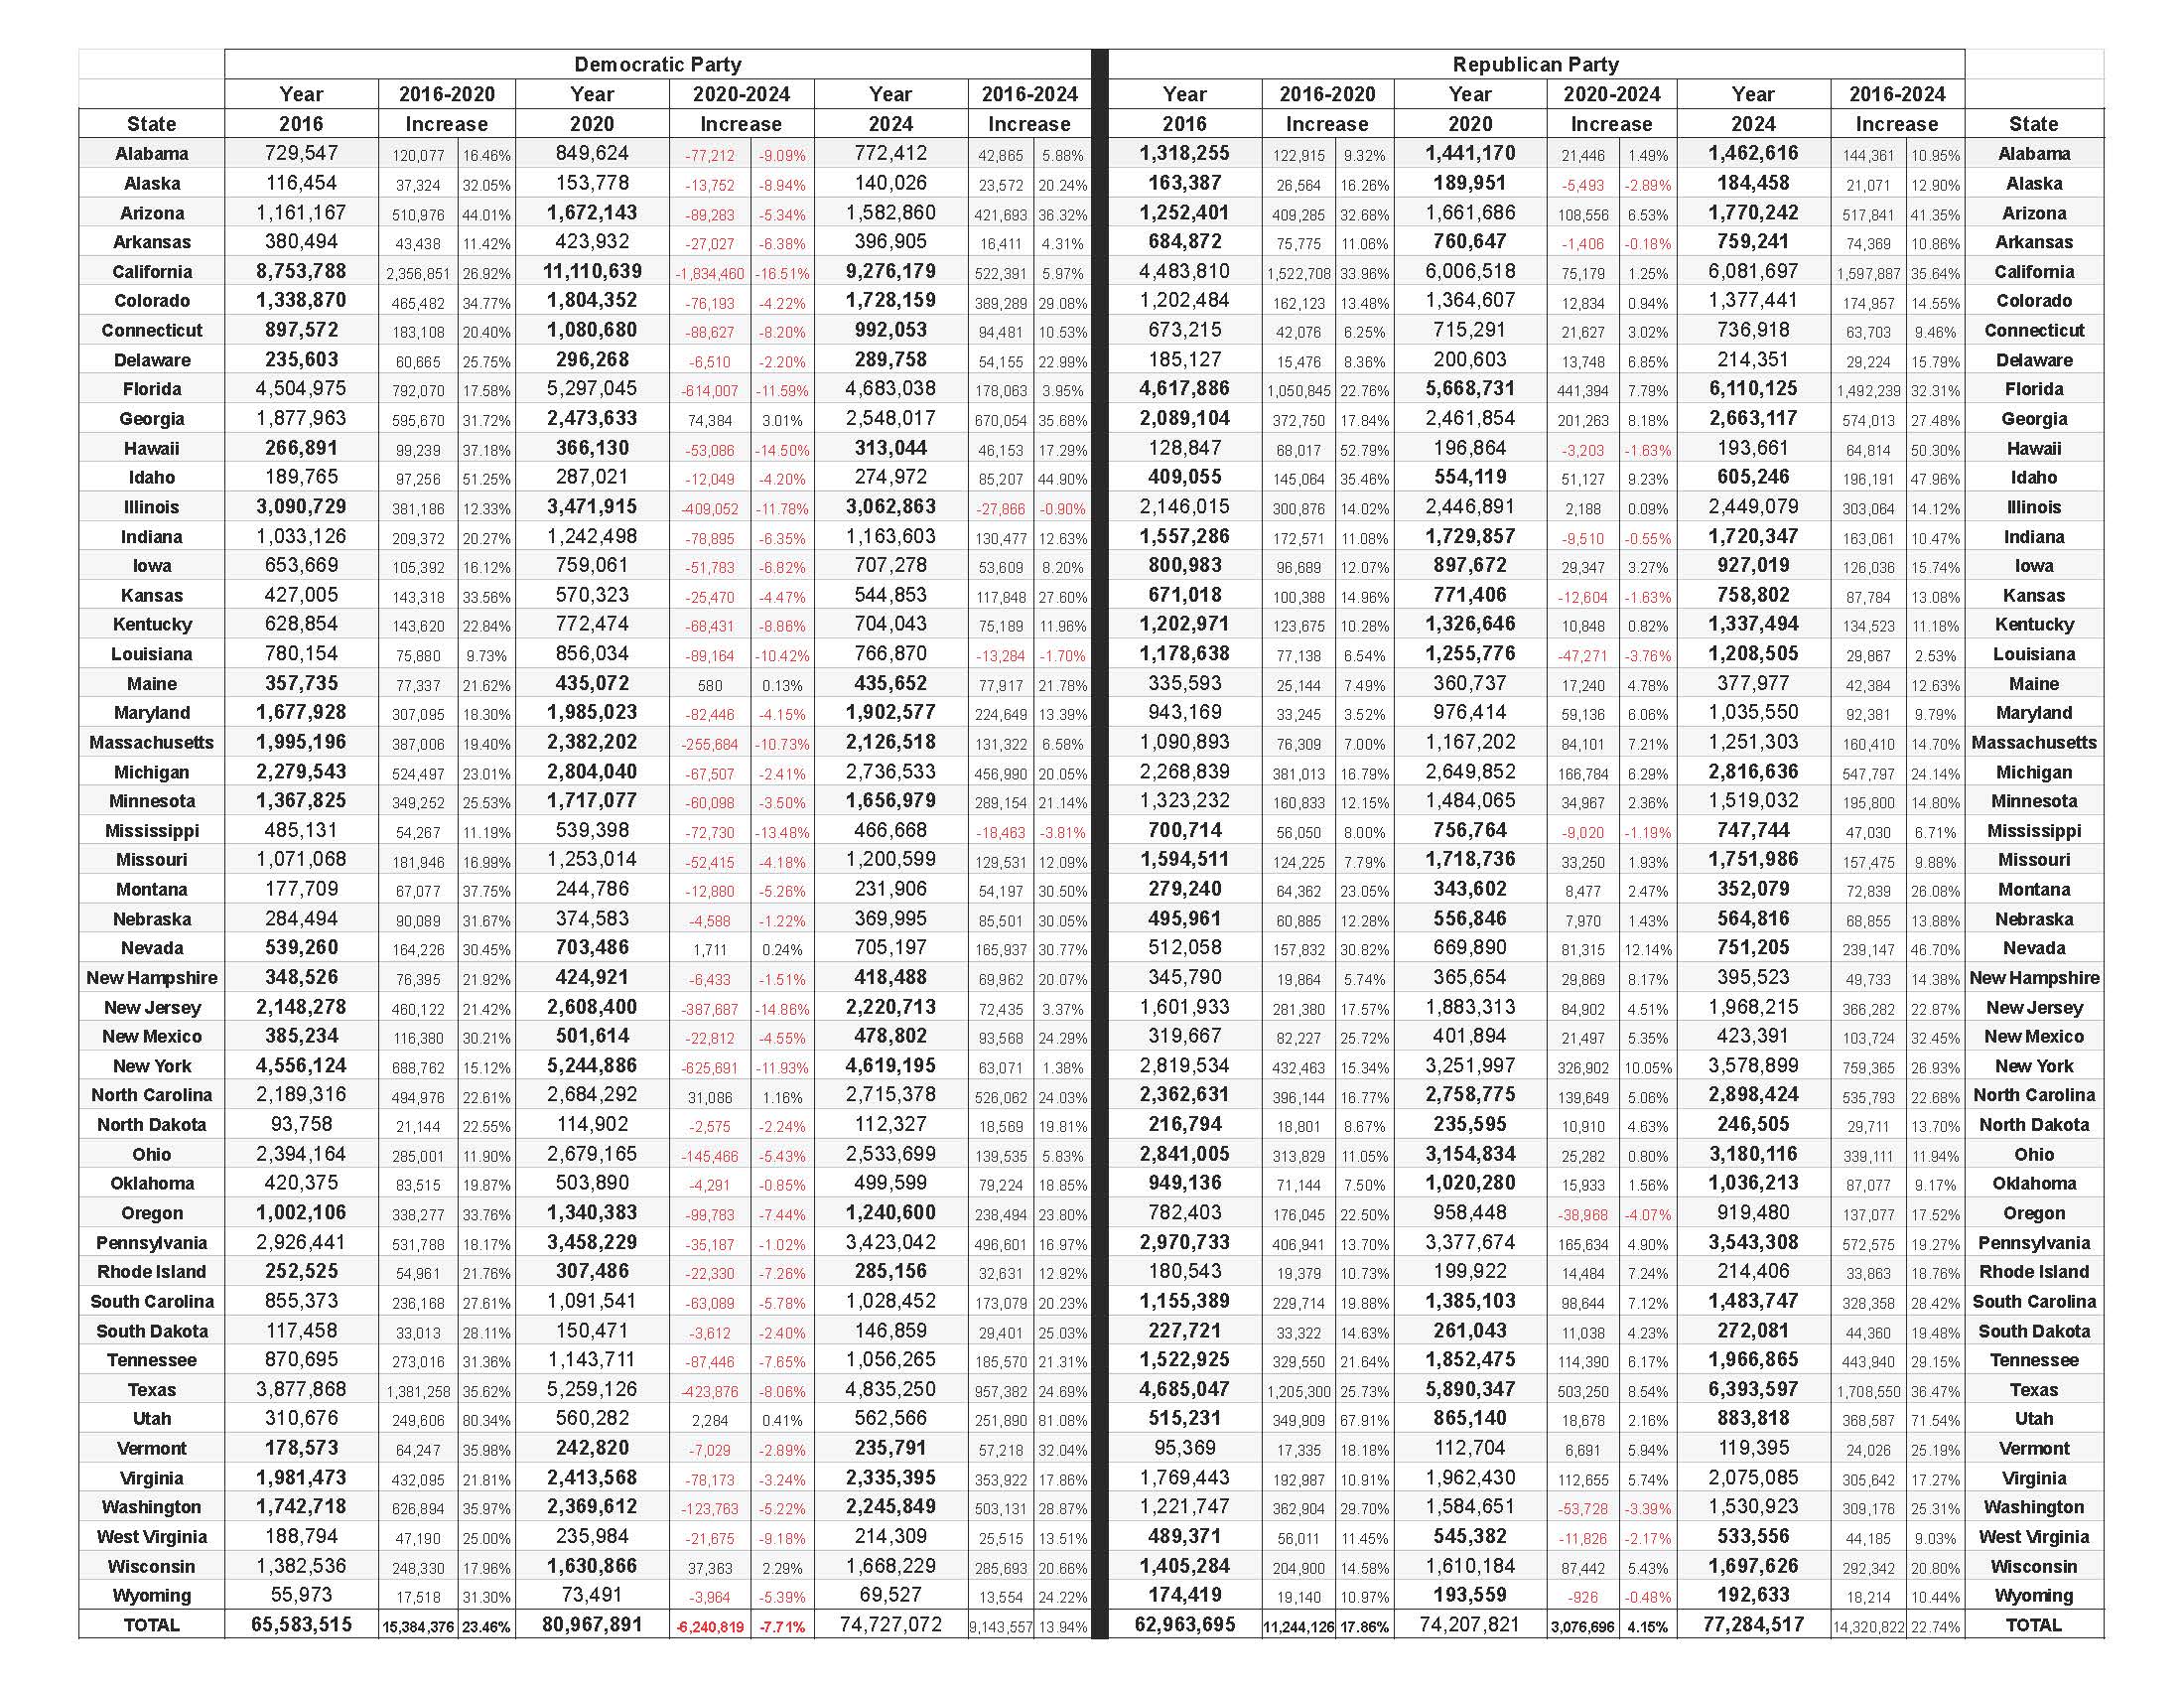
It’s obvious to me that something very unusual took place regarding the rapid increase in voter turnout in the 2020 election (you’re welcome to your opinion on that) and the Democratic Party was not able to maintain that increase in voter turnout for the 2024 election where the Republicans were able to maintain and even increase voter turnout for 2024. I’ll be interested to see how voter turnout in 2028 changes.
To return to my original question, “Can Past Presidential Election Statistical Trends Teach Us Anything Valuable Today?” Personally I don’t see how any of that information can help predict the next major ideological pendulum swing.
“The political left has shown its pattern of propaganda lies within their narratives so many times since 2016 that it’s beyond me why anyone would blindly accept any narrative that the political left and their lapdog media actively push?” Steve Witherspoon
I’ve personally observed how the Democratic Party has devolved over the last eight years into the anti-Constitution party and a bunch of liars and they are trying to push the pendulum over the extreme left edge so it can never return to center. So, if I’m not alone in that observation, and I don’t think I am, then the Democratic Party, as a whole, should take a severe hit in this presidential election even with that loose cannon mouthed, easy to hate, narcissistic Trump as the opposing candidate. The obvious artificially created Chameleon “new and improved” Harris has got to be the worst example of a puppet candidate that we’ve ever had and those that can’t or won’t see that are so partisan biased that they’re likely beyond repair.
If the pendulum doesn’t swing away from the anti-Constitution totalitarian leanings of the political left and back towards our Constitution really soon we’re going to be in for a very, very rough ride.
“Based on observed cultural, societal and political patterns in the 21st century, I see the 2024 election as being a societal and cultural disaster for the United States of America. No matter who is elected, the reactions are going to be bad, and they’re likely to be very bad.” Steve Witherspoon
DO NOT MISS THE FOLLOWING LINK!
DO NOT IGNORE THE CONTENTS BECAUSE OF THE INTERVIEWER, WATCH IT!
“Let’s say Trump wins.. what happens?”
There is value to watching the entire video but be warned, it is very long. There are some boring parts but there are many interesting parts.
I can’t hardly wait to see the 2024 election by county graphic information.
Featured Photo Credit: The USA Map Graphic for the blog post was obtained from here and I modified it with the word VOTE.
[UPDATE 11/16/2027: Added the 2024 maps and 44 year data comparison as of today.]
